Dynamic Excel charts are so much appealing to users and more pleasant in interaction. Fortunately Excel has PivotCharts and Slicers. But what if you want to have more control over your charts and use other controls such as Dropdowns, ScrollBars and Radiobuttons? Today I will show you how to easily use Form Controls to add interactivity to your Excel Charts without any VBA nor PivotTables/PivotCharts.
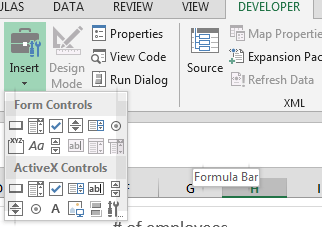
Form Controls
What are Form Controls? Form Controls can be accessed from the Developer ribbon in Excel (File->Options->Customize Ribbon). They are simple controls that can be dragged-and-dropped onto your Worksheets and easily configured.
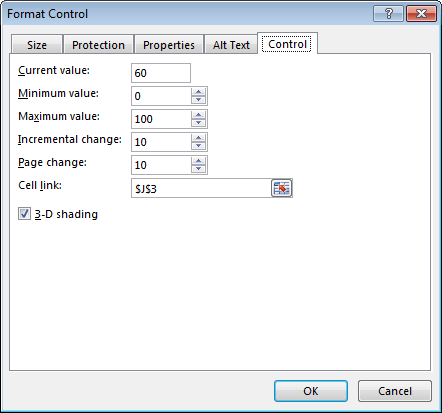
What makes Form Controls special? They are configurable and can be linked to cells in your Excel Workbook. Look below for an example of how the ScrollBar properties look like. Notice especially the Cell Link property which will output the current value of the Form Control (in this case the scroll value). This opens a whole lot of different possibilities to use Form Controls in calculations/charts etc.
Dynamic Excel Charts with a ScrollBar
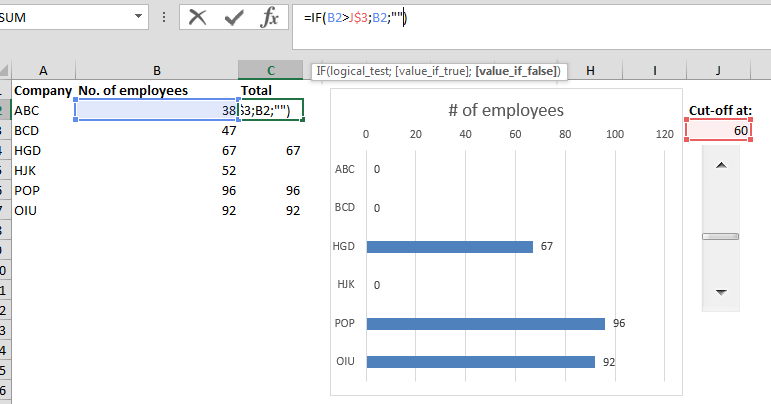
Let’s consider a first example with a ScrollBar.
On the left there is a simple table with 3 columns:
- Company – name of a company
- No. of employees – number of employees in the company
- Total – the number to be presented in the chart cut off by the ScrollBar (only showing values above)
Notice that the Total formula take the value from the ScrollBar to set the current cut-off. By scrolling the ScrollBar notice that the formulas will automatically recalculate and the chart will refresh to show only values above the cut-off. Neat huh?
I tend to usually overlay the Form Controls over the chart itself so it is more obvious for the user that the chart is dynamic.
For Excel 2013 users – you can also use timeline scrollbars natively in PivotTables/Charts (available on the Analyze ribbon tab).
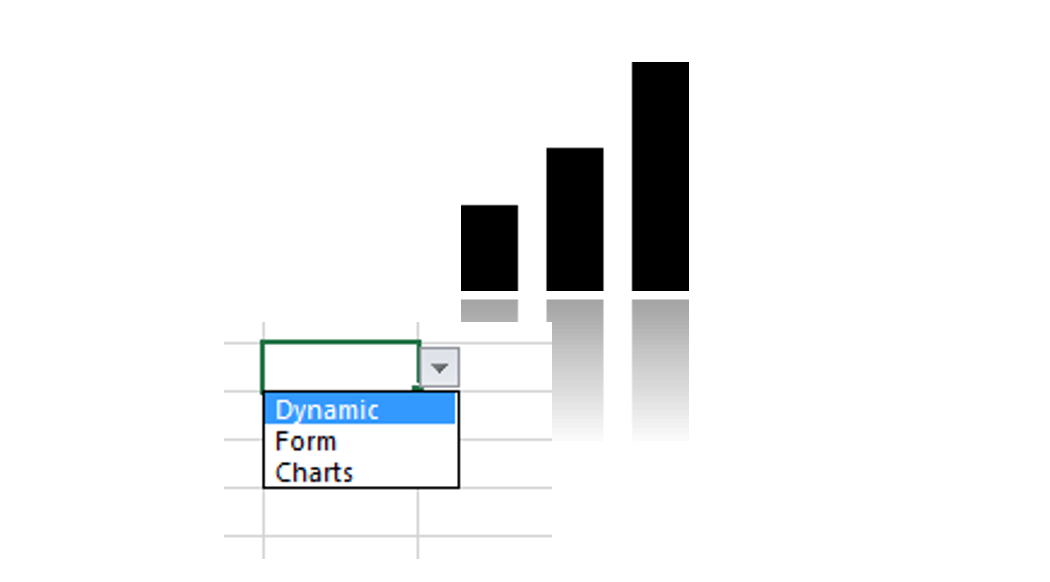
Dynamic Excel Charts with a Dropdown
Let’s now consider a different example using a Dropdown form control.
Again on the left side notice the data source table. I have simply split the employee column into two sections: IT employees and non-IT employees.
We will also create a dropdown with 3 options:
- IT – sum only IT employees
- Non-IT – sum only non-IT employees
- All – sum all employees
Having these three categories we can link them to the Dropdown control so they appear when click on the bottom arrow. Simple right? Now let’s link the H2 cell with the Dropdown control value and we can now see the changes in the selection of the Dropdown. Notice that the Total cell formula with show different value depending on the selection in the Dropdown. Easy right?
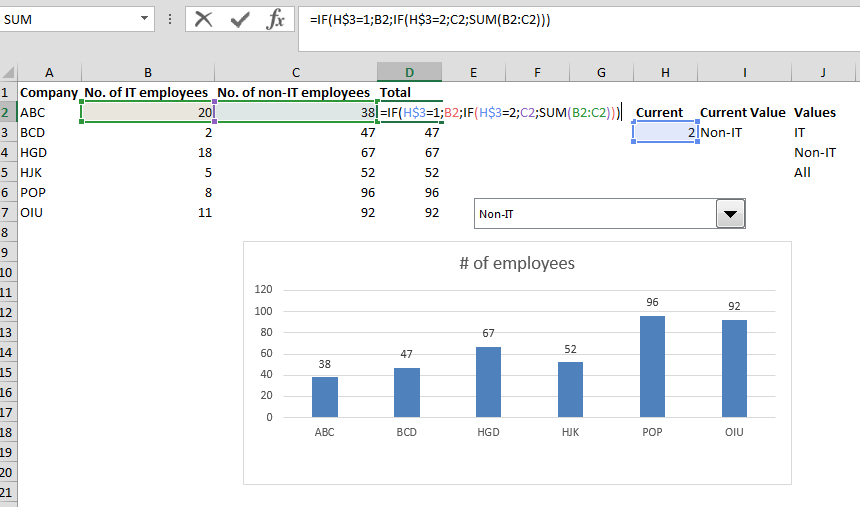
Again I would recommend overlaying the chart with the Dropdown to make it seem like a natural part of the Excel Chart.
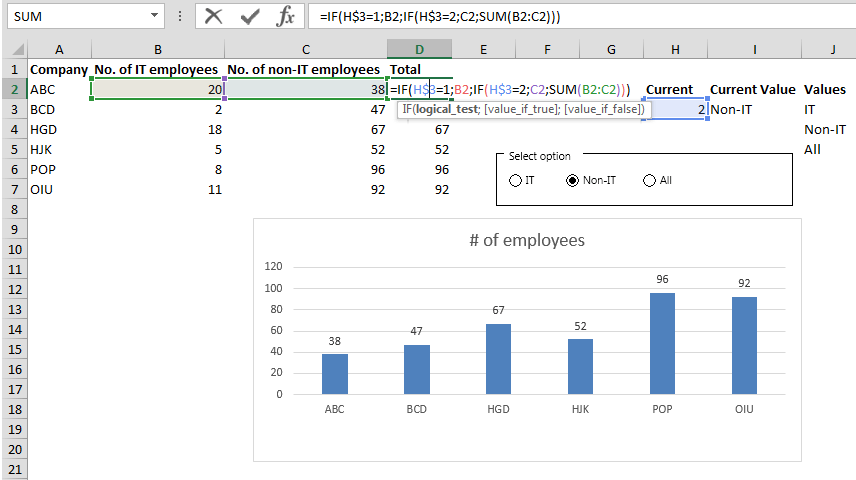
Dynamic Excel Charts with a Radiobuttons
Radiobuttons work similarly as Dropdowns with the difference that you have to group them using the GroupBox control to achieve mutual exclusion. See the example below:
Next steps
Excel Google Charts Tool – Learn how to add cool Google Charts to your Excel Workbook