
Technically in PowerPoint you can link an Excel file to a PowerPoint presentation. However that will not make the Chart dynamic, and sometimes it is hard to say when the Chart will be updated. But what if we want even more – what if we want the chart to refresh during a Presentation? I can imagine this can have many uses. Imagine wanting to present a series of dynamic slides in an Office environment, each slide showing latest charts from an updates Excel dashboard. In other cases you may want to prevent any linking out to Excel files and simply have a dynamic reference to your source file or files. Today we will explore how to create Dynamic Charts in PowerPoint using VBA.
See an example in this Youtube video:
Why not use Linked Charts?
Before we start I want to explain that you don’t need to use the approach explained below to simply link an Excel Chart to a PowerPoint presentation. If this is all you need, read this Support Office article. The purpose of this exercise is to avoid linking at all and make it entire flexible on your own preference when you want to update your Charts and even update the Excel files before doing so.
Creating Dynamic Charts in PowerPoint
Below is a step by step tutorial of how to setup the Charts and Macro:
Create the PowerPoint and Shapes
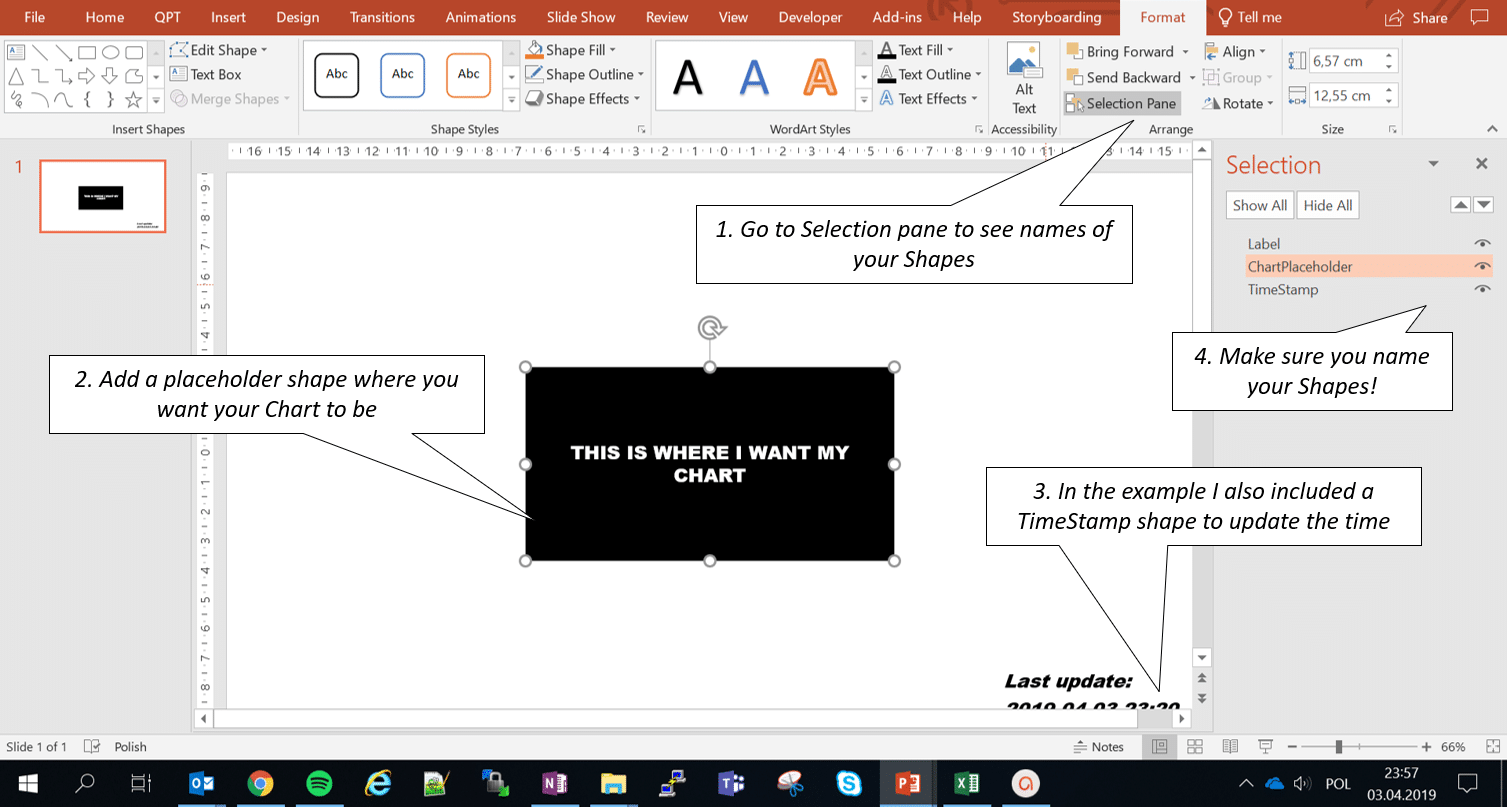
First we need to create a PowerPoint Shape that will be used as a placeholder to mark the location and size of our Chart. Click on image below for a reference.
Create an Excel Chart
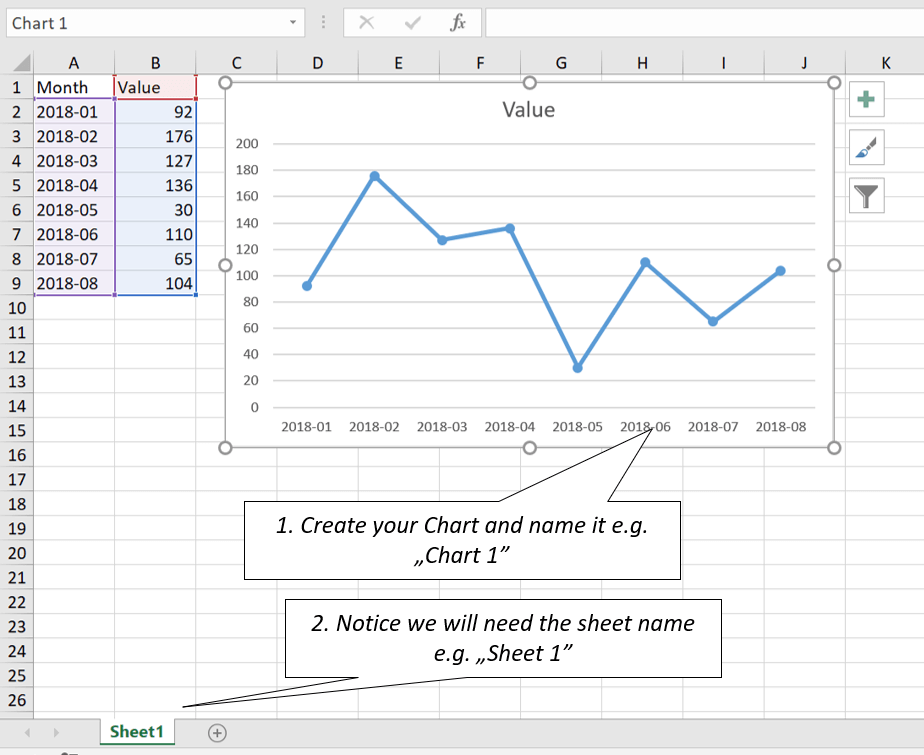
Next we need to create and name an Excel Chart. This will be copy pasted as an Image to our PowerPoint to avoid linking and to assure the format is identical to how it is visualized in your Excel file.
Create the Dynamic Charts VBA macro
If you don’t know how to access your Developer tab you can proceed similarly as in Excel. Next create a new VBA Module and copy the following VBA code:
#If VBA7 Then
    Public Declare PtrSafe Sub Sleep Lib "kernel32" (ByVal milliseconds As LongPtr) 'MS Office 64 Bit
#Else
    Public Declare Sub Sleep Lib "kernel32" (ByVal milliseconds As Long) 'MS Office 32 Bit
#End If

Function CopyChartFromExcelToPPT(excelFilePath As String, sheetName As String, chartName As String, dstSlide As Long, Optional shapeLeft As Long, Optional shapeTop As Long, Optional shapeWidth As Long, Optional shapeHeight As Long) As Shape
    On Error GoTo ErrorHandl 'Handle Errors

    'Set Variables and Open Excel
    Dim eApp As Excel.Application, wb As Excel.Workbook, ppt As PowerPoint.Presentation, ws As Excel.Worksheet
    Set eApp = New Excel.Application
    eApp.Visible = False
    Set wb = eApp.Workbooks.Open(excelFilePath)
    Set ppt = ActivePresentation

    'Copy Chart in Excel
    wb.Sheets(sheetName).ChartObjects(chartName).Copy

    'Paste into first slide in active PowerPoint presentation
    ppt.Slides(dstSlide).Shapes.PasteSpecial ppPasteBitmap
    Set CopyChartFromExcelToPPT = ppt.Slides(dstSlide).Shapes(ppt.Slides(dstSlide).Shapes.Count)
    'Close and clean-up Excel
    wb.Close SaveChanges:=False
    eApp.Quit
    Set wb = Nothing: Set eApp = Nothing

    'Move the new shape if left/top provided
    If Not (IsMissing(shapeTop)) Then
        With CopyChartFromExcelToPPT
            .Left = shapeLeft
            .Top = shapeTop
        End With
    End If


    If Not (IsMissing(shapeWidth)) Then
        With CopyChartFromExcelToPPT
            .LockAspectRatio = False
            .Width = shapeWidth
            .Height = shapeHeight
        End With
    End If

    Exit Function
ErrorHandl:
    'Make sure to close the workbook and Excel and return False
    On Error Resume Next
    If Not (eApp Is Nothing) Then
        wb.Close SaveChanges:=False
        eApp.Quit
    End If
    Set CopyChartFromExcelToPPT = Nothing
End Function
Let me break this down. Above first we defined the VBA Sleep function as we will use it as a delay mechanizm between updates. Next we define the CopyChartFromExcelToPPT function which basically does the following:
- Open an Excel file defined with excelFilePath
- Copies the chart chartName from the sheet sheetName
- Pastes it into the ActivePresentation on slide dstSlide an the location shapeTop and shapeLeft and with the size of shapeWidth and shapeHeight
As you can see this is a generic function you can reuse to your own purpose regardless of the example usage below.
Auto refresh the Chart
Now let us create simple scenario using the generic function for copying an Excel Chart to PowerPoint:
- Run in Presentation mode
- Every second update the Excel Chart and update the TimeStamp
- Exit Presentation mode
Below VBA code does exactly that:
Sub TestAutoUpdate()
    Dim shp As Shape, shp1 As Shape, shpTxt As Shape
    Dim chartPlaceholder As Shape, timeShape As Shape, slideNumber As Long
    'Get placeholder shapes, hide ChartPlaceholder
    slideNumber = 1
    Set chartPlaceholder = ActivePresentation.Slides(slideNumber).Shapes("ChartPlaceholder"): chartPlaceholder.Visible = msoFalse
    Set timeShape = ActivePresentation.Slides(slideNumber).Shapes("TimeStamp")

    'Start the presentation!
    ActivePresentation.SlideShowSettings.Run

    'Update the Chart and set time stamp
    Set shp = CopyChartFromExcelToPPT(ActivePresentation.Path & "\Test.xlsx", "Sheet1", "Chart 1", slideNumber, chartPlaceholder.Left, chartPlaceholder.Top, chartPlaceholder.Width, chartPlaceholder.Height)
    timeShape.TextFrame.TextRange.Text = Format(Now(), "YYYY-MM-DD HH:MM")
    DoEvents
    Sleep 1000
    For i = 0 To 3
        'Update the Chart, delete old shape and set time stamp
        Set shp1 = CopyChartFromExcelToPPT(ActivePresentation.Path & "\Test.xlsx", "Sheet1", "Chart 1", slideNumber, chartPlaceholder.Left, chartPlaceholder.Top, chartPlaceholder.Width, chartPlaceholder.Height)
        shp.Delete: Set shp = shp1
        timeShape.TextFrame.TextRange.Text = Format(Now(), "YYYY-MM-DD HH:MM")
        'Sleep for 1 second
        DoEvents
        Sleep 1000
    Next i
    'End of presentation!
    ActivePresentation.SlideShowWindow.View.Exit
    'Delete the chart and make the ChartPlaceholder visible again
    shp.Delete
    chartPlaceholder.Visible = msoTrue
End Sub
Use Cases of Dynamic PowerPoint Charts
For me a way to animate Excel Charts in PowerPoint present a new pallete of options to further push the boundries of what we can do with PowerPoint. Below a short list of ideas that can help you image how useful this can be:
- Create a dynamic Office presentation with auto refreshing Charts from multiple Excel files
- Create a button to manually refresh single or all Charts in your PowerPoint deck
- Create an easy way to link your charts in PowerPoint to Excel files that might move (e.g. link to Excel files in same directory
")


Hi, would this work for powerpoint/excel/office 2019 for mac too? The example this post describes looks to have been done in windows, so I can’t tell whether it would also work for mac, so I wanted to ask you before investing the time, thanks!