Excel is most appreciated for it’s ease of use as a Data Analysis Tool. I mean to explore the basics, as well as the more advanced Data Analysis Excel Tools. Be sure to read through the Other Tools section below for other honorable mentions.
The DATA ribbon tab
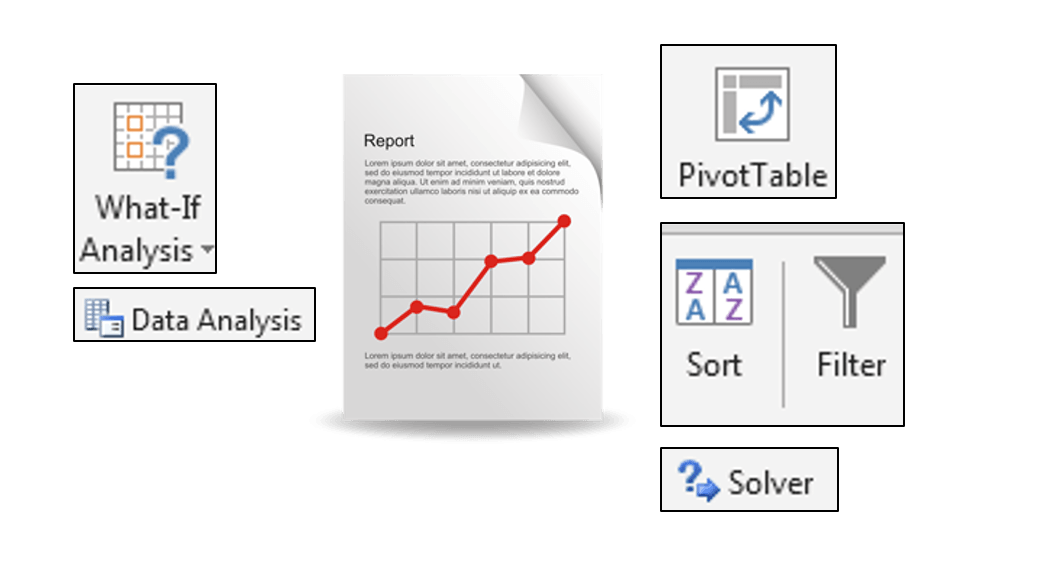
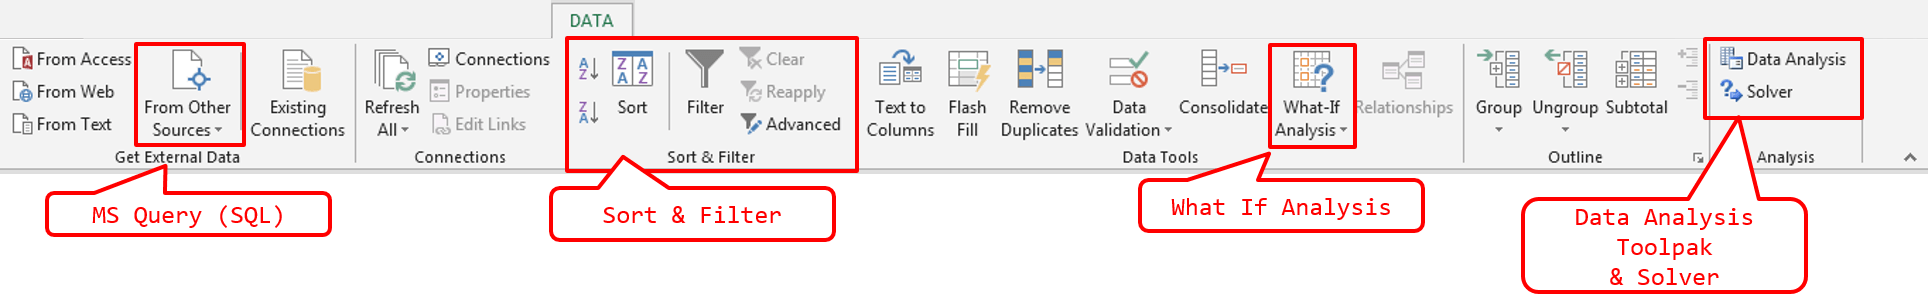
As some of you already have noticed MOST (except for the PivotTable for no good reason) of the tools described in this post focus on features available BY DEFAULT within the Excel DATA ribbon tab (see image below). Some of them are AddIn that are installed by default along with MS Office, however, need to be activated manually. Skip to the relevant section of this post to read more.
 In this post I am focusing just on features that allow you to explore data or solve certain analytical problems. I am not focusing on simple data transformation features like removing duplicates, however, I do encourage that you learn more on these non-mentioned features.
Sort & Filter
Let’s kick off with the Sort & Filter group. See below for a quick look at how to use the Sort and Filter feature in Excel on an example data set:
PivotTable
PivotTables are so versatile a tool that most often no other Data Analysis Tool is needed. PivotTables are great for exploring data sets and for visualizing data with the help of automatically generated PivotCharts. See a simple PivotTable example below:
What If Analysis
The What If Analysis button in the DATA ribbon tab facilitates generally two useful features:
- Scenario Manager – the scenario manager allows you to add several scenarios to a certain problem and then generate a summary comparing how the scenario values impact a selected cell value
- Goal Seek –
- Data Tables – creating scenarios
Let’s explore these tools (apart from the last one) on a simple problem case example.
The problem:
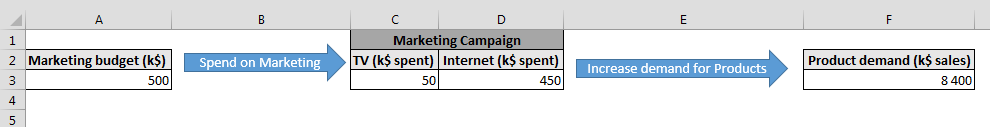
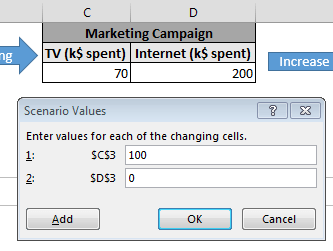
Our example assumes there is a 500k$ Marketing Budget to spend on a Marketing Campaign which can consist of spending on Internet and/or TV ads. What is more, for the sake of the example let’s assume:
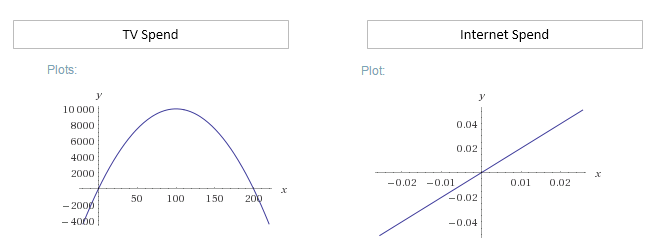
- TV ads have a parabolic impact (see below) on Product demand i.e. at first the more you spend the more Product demand you generate, until you reach a peak where Product demand will actually fall (maybe viewers are tired of their favorite programs being bombarded by your ads).
- Internet ads have a linear impact on Product demand i.e. the more you spend the more Product demand you generate
The Product demand cell formula is:
=2*D3+((C3-100)^2*-1+10000)
Scenario Manager
Using the example mentioned above let’s use the Scenario Manager to create 3 separate scenarios:
- 100% TV spend – 500k$ spent on TV ads
- 50% TV and Internet spend – 250k$ spent both on TV and Internet ads
- 100% Internet spend – 500k$ spent on Internet ads
Open the Scenario Manager
To add our scenarios go to the DATA ribbon tab, click What If Analysis and then select Scenario Manager....
Click Add to add a new Scenario
Specify the Scenario details – especially the range of Changing Cells that are to be specified by the scenario:
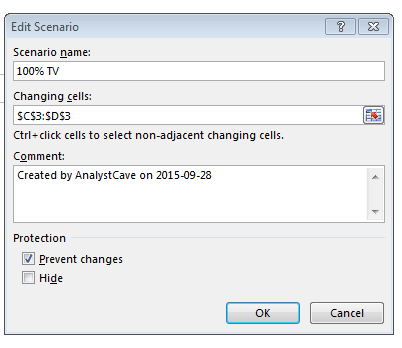
Next provide values as appropriate to your Scenario:
Repeat for each Scenario
You need to Name and specify the Changing Values for each Scenario separately.
Generate a Summary
Hit Summary... to generate a neat worksheet with a summary of your Scenarios. Specify the Result Cells – cells which will be modified in result to your Scenario. In my case it is just the Product demand cell:
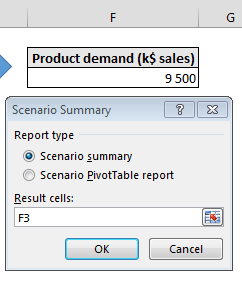
Now admire the results:
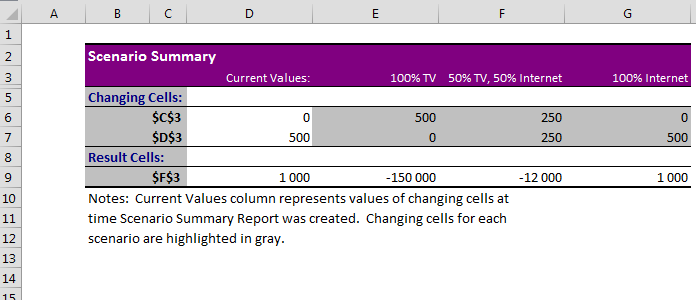
Notice that in this example on purpose I created the formula as such so that it is not directly obvious (unless you work out the formula maximum) what is the best mix of TV and Internet ads. We will work through this example using different tools below.
Goal Seek
Goal Seek calculates the values necessary to achieve a specific goal. The “goal” is an amount returned by a formula. So in short – you should use Goal Seek if you have a function which characteristics are unknown or hard to figure out. Goal Seek is Solver’s younger (less developed) brother.
Some examples of when to use Goal Seek:
- Solving single (changing) parameter mathematical functions (seeking a specific value e.g. 0)
- Doing a quick check if a single parameter can help achieve a specific value for a formula (e.g. financial statements)
Using Goal Seek
Ok let’s learn how to apply Goal Seek. Let’s reuse our above example – let’s say we are aware that our TV ads function is a parabolic or a polynomial at least and we want to quickly locate some of it’s 0 values.
Our Product demand (just for TV ads) looks as so if we ignore the Internet ads:
=((C3-100)^2*-1+10000)
Where C3 is Marketing Spend on TV ads.
Open Goal Seek
Go to the DATA ribbon tab, click What If Analysis and then select Goal Seek.
Provide the Goal Cell, Value and the Changing Cell
For our example the Goal is our Product demand, and our Changing Cell will be the Marketing Spend on TV ads:
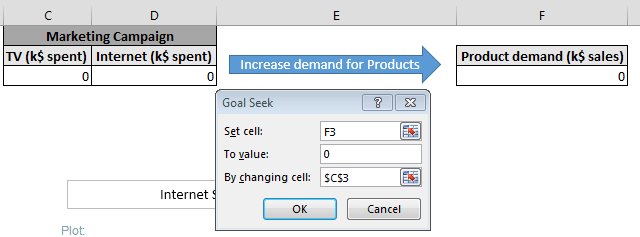
Run Goal Seek and BEWARE!
This is the result I received. Notice that the value I provided into the TV ads cell was 0 to start with.
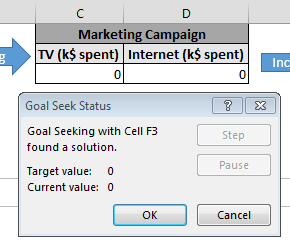
This time Goal Seek came up with the result: 0. Ok now let’s rerun this example. But this time I will type a higher starting value for TV ads spend… say 150k$. Do you think it will provide the same result? See below:
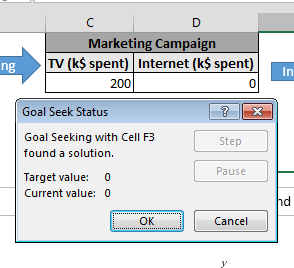
The computed result is different! This time Goal Seek came up with the result: 200. No why is that? Goal Seek is an iterative algorithm that in an iterative manner seeks to reach the Goal Value. However, if a function (cell formula) has several solutions expect that Goal Seek may land at different values.
This is very important to keep in mind!
Goal Seek in VBA
Not many know that you can use Goal Seek easily in VBA too! The parameters are as such:
Range.GoalSeek(Goal, ChangingCell)
where:
- Range – single cell with Goal function (formula)
- Goal – the Goal Value to achieve
- ChangingCell – single cell which will can be modified to achieve the Goal
MSDN provides a sexy example below:
Worksheets("Sheet1").Range("Polynomial").GoalSeek Goal:=15, ChangingCell:=Worksheets("Sheet1").Range("X")
Data Analysis Toolpak
Also know as Analysis Toolpak is a Microsoft AddIn delivered with Excel (usually disabled by default) that provides data analysis capabilities to Excel. Let’s start by enabling this AddIn:
Enabling the Analysis Toolpak
Find Add-Ins in Excel Options
To open the Window go to FILE, select Options and then pick AddIns.
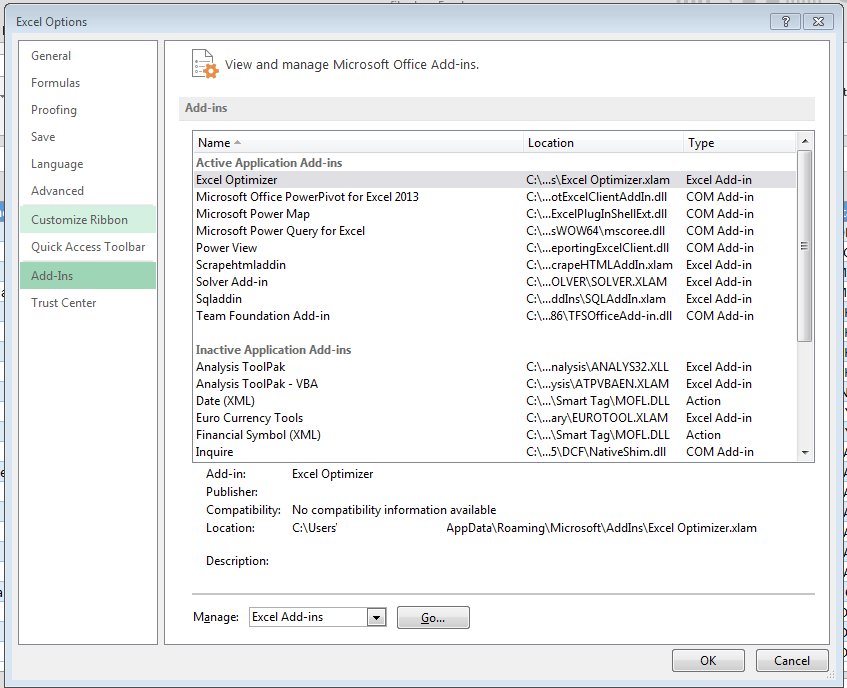
Next from the above window hit Go to progress to Step 2.
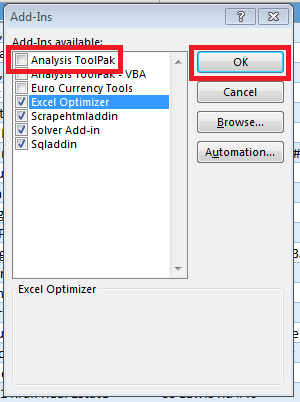
Open the Add-Ins window and enable the Add-In
From the Window below select Analysis Toolpak and hit OK:
Using the Analysis Toolpak
To open the Analysis Toolpak window simply go to the DATA ribbon and you should find at your far right in a new group (Analysis) the Data Analysis button. Hit it to open the whole range of Data Analysis Excel tools.
![]()
Click on the button to see the whole list of different tools:
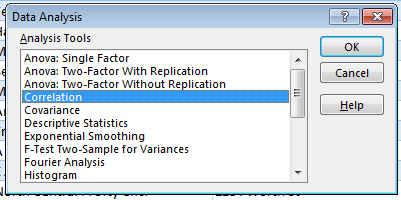
I won’t go through all these tools as they are pretty straightforward. Personally I tend to use only the Correlation feature which creates a nice correlation matrix out of a series of numerical columns.
Solver
Solver is a Microsoft AddIn to Excel that allows you to find optimal solutions for certain decision problems defined by a certain Objective (cell value). It’s like the older brother of the previously mentioned Goal Seek as it allows for more complicated computations and optimization making. Let’s start by enabling it in Excel.
Enabling the Solver AddIn
Find Add-Ins in Excel Options
To open the Window go to FILE, select Options and then pick AddIns.
Next from the above window hit Go to progress to Step 2.
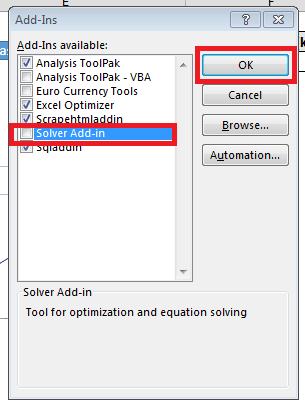
Open the Add-Ins window and enable the Solver Add-In
From the Window below select Solver Add-In and hit OK:
Using the Solver AddIn
Now similarly as above let’s again consider our Problem from above.
As previously let’s exemplify this tool with our Marketing Budget example. Quick reminder – we have 500k$ to spend on TV and Internet ads and we have a formula that calculates our spend to the resulting Product demand.
Now we want to know what is the optimal value of our spend on TV and Internet ads to maximize Product demand. This is exactly what we can calculate with Solver:
To open Solver window simply go to the DATA ribbon and you should find at your far right in a new group (Analysis) the Solver button. Hit it to open the Solver wizard:
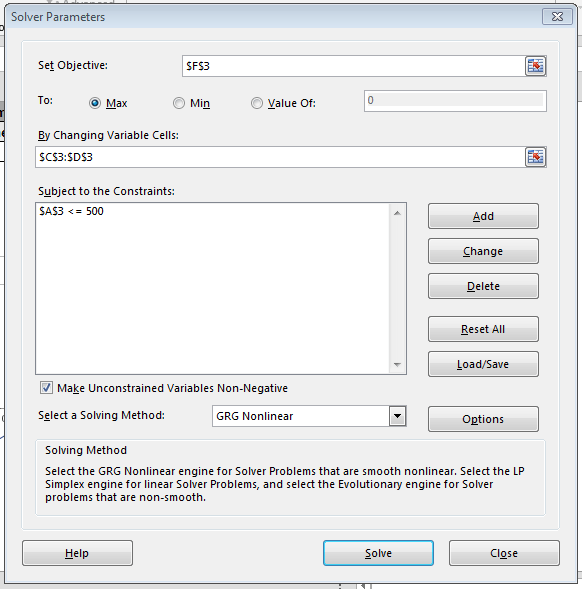
Solver requires that you:
- Specify the Objective – set a single cell that measures your Objective. Next select whether you want to Maximize, Minimize or set this value by changing certain variables (specified later)
- Specify the Changing Variables – specify the variables (cells) which should be modified by Solver to optimize your Objective function (formula)
- Specify your Constraints – specify cells which should evaluate to certain constraints limiting the values of the Changing Variables
I used the settings above to run Solver on my Problem. See the results below:
![]()
The results are perfect (99 for TV ads and 401 for Internet ads)! Solver managed to find the optimal solution to my problem. Some of you probably thought the answer to be 100 and 400 🙂 – that was the hinted answer but not the optimal one! This is the power of Solver.
MS Query (SQL)
If you have been around my blog long enough you might have noticed my affection towards SQL in Excel manifested by my SQL Excel AddIn. I consider SQL a significant tool in the Data Analysis Excel toolbox. There are simply some things you won’t do easily with a PivotTable that can be easily written in a few SQL lines of code.
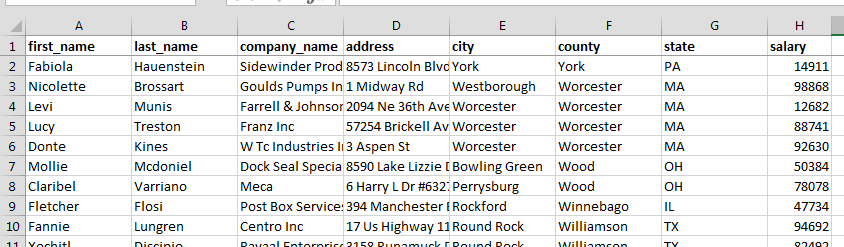
Let’s demonstrate a simple example of how to create a MS Query using the DATA ribbon tab using a simple source worksheet – Sheet1:
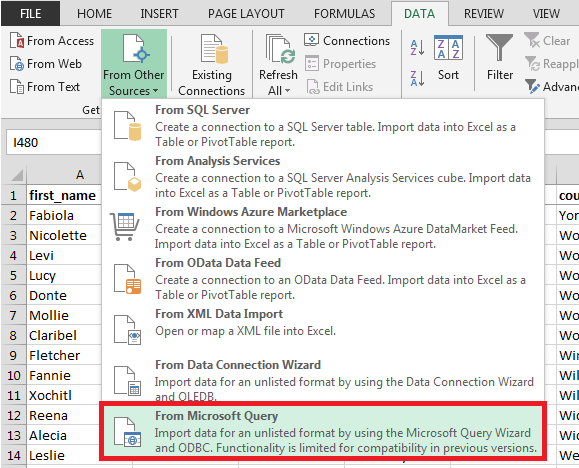
Open the MS Query window
Go to the DATA ribbon tab, click From Other Sources and then select From Microsoft Query.
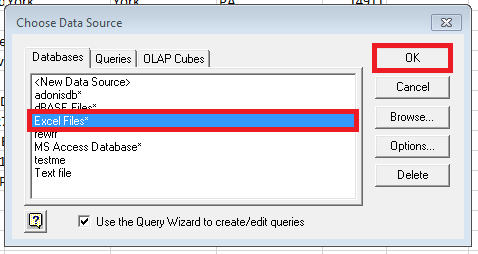
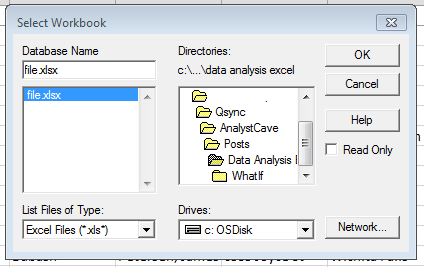
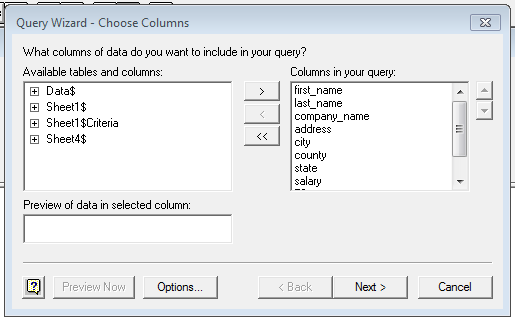
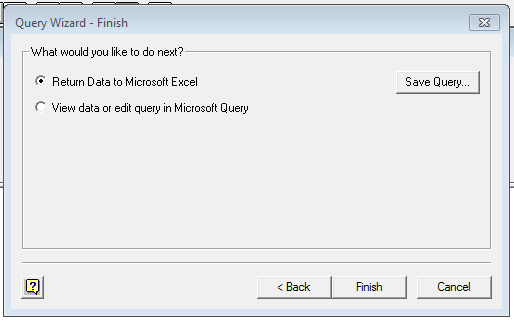
Follow the MS Query window wizard to create your MS Query
This is the hard part. In my example I want to run a query against my working Workbook (Sheet1). See screens below:
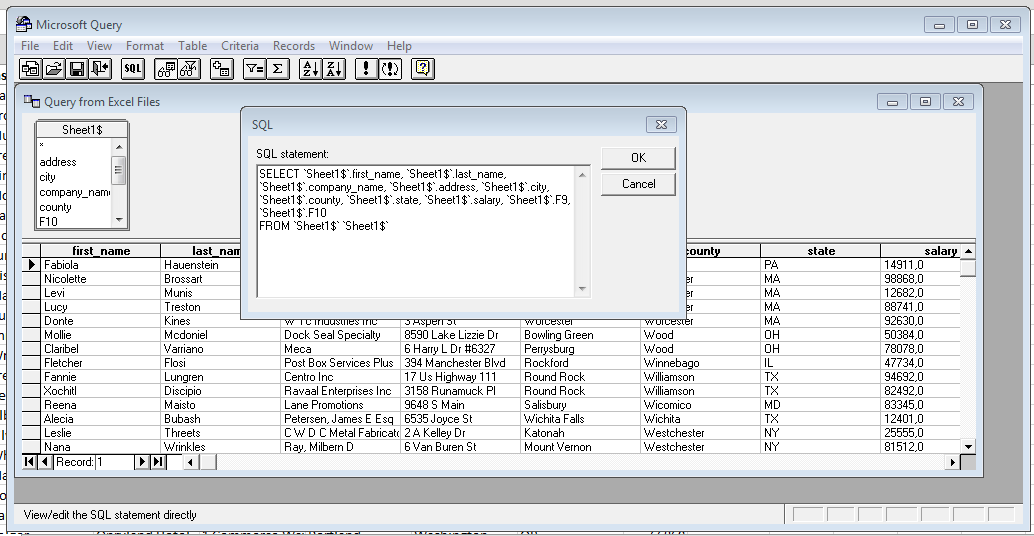
Indeed that’s a lot of steps right? Hence, if you consider using MS Query (SQL) I strongly recommend my SQL Excel AddIn. It does the same in just 1 step. It does not add any new features to Excel but simply makes it so easy to create MS Queries in Excel – so you can just use it to create the queries using the AddIn. The AddIn is not required to use them.
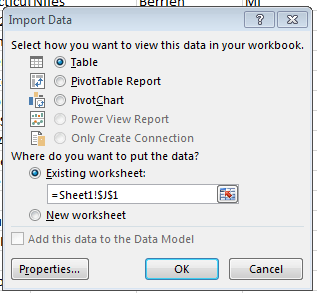
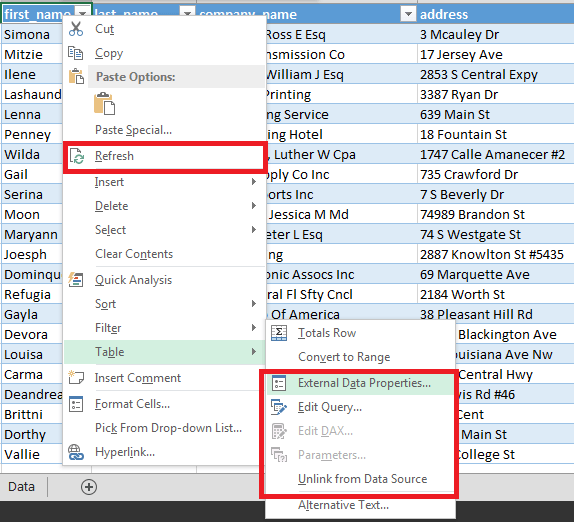
Refresh or Edit your MS Query
This is the wonderful part – your MS Query is represented in Excel as a QueryTable. A queryable Excel Table that can be Refreshed or modified. See the options below available for QueryTables:
Summary: Data Analysis Excel
It is worth at least being aware of the wide range of Excel Data Analysis tools that are available by DEFAULT in Excel. Most Excel users are limited to the PivotTable and maybe Solver (2 common Excel questions asked for Analyst job interviews). However, Excel contains much more Data Analysis Excel tools than just those two.
I personally see much value in the MS Query (SQL) feature which has been so successfully hidden in Excel and made so hard to setup that it is simply neglected. Fortunately, there is a way around that with my SQL AddIn which I myself use on a regular basis. SQL however is a powerful tool (and language) and often allows you to create queries that can replace VBA macros and in most cases will run faster than VBA.

")


")