![]() Twitter is currently the 7th most popular Social Platform with millions of Tweets being created daily. Often we can hear on the news from Twitter before it gets published to over news sites. It provides a plethora of data that we as analysts can use to understand peoples sentiment as well as create early warning systems of certain events. Similarly there are certain financial assets, such as Bitcoin, that are more affected by news and sentiment than actual fundamentals. One tweet from Elon Musk may equally launch a buying or selling spree on a certain asset with no warning. That is why recently I got interested in learning how to crunch this gold mine of data.
Twitter is currently the 7th most popular Social Platform with millions of Tweets being created daily. Often we can hear on the news from Twitter before it gets published to over news sites. It provides a plethora of data that we as analysts can use to understand peoples sentiment as well as create early warning systems of certain events. Similarly there are certain financial assets, such as Bitcoin, that are more affected by news and sentiment than actual fundamentals. One tweet from Elon Musk may equally launch a buying or selling spree on a certain asset with no warning. That is why recently I got interested in learning how to crunch this gold mine of data.
Why Power BI?
![]() As much as I like Python, I feel Power BI is a much easier tool to use for doing data analysis and dashboards I might want to return to in order to regularly review what insights I can gain from Twitter data. Python has truly great visualization libraries provided you are very fluent with them. However, Power BI has the benefits of being a drag-and-drop tool with an lower learning curve than Matplotlib or Seaborn.
As much as I like Python, I feel Power BI is a much easier tool to use for doing data analysis and dashboards I might want to return to in order to regularly review what insights I can gain from Twitter data. Python has truly great visualization libraries provided you are very fluent with them. However, Power BI has the benefits of being a drag-and-drop tool with an lower learning curve than Matplotlib or Seaborn.
Power BI also has a connector available that allows you to directly query Azure Databricks tables with limited hassle. Hence, today let me share with you how to setup and create your own Twitter Power BI dashboard from zero to hero!
Architecture of the Solution
Below you can find a snapshot of the overall solution architecture. I built it on the Azure Cloud for convenience as well as because I wanted to seamlessly connect my data to Power BI through the available connectors.
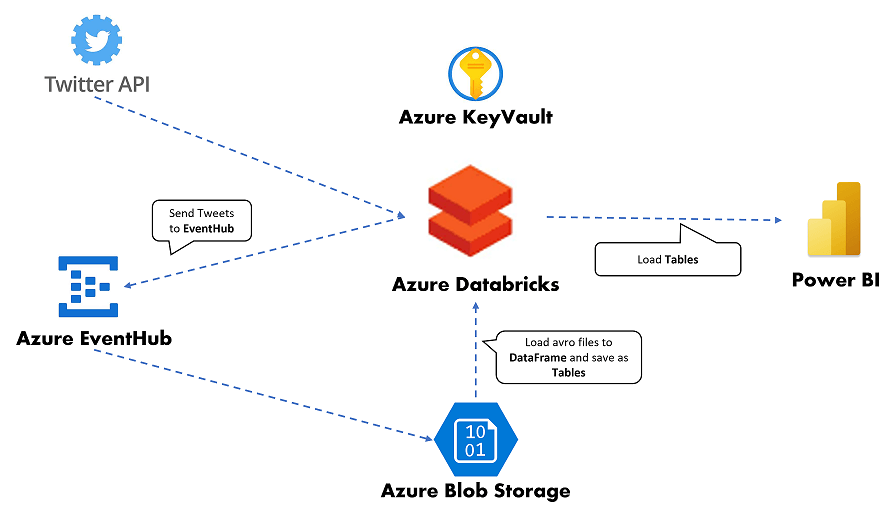
The solution is built on the following building blocks:
- Twitter API – Twitter fortunately extends an API which is pretty robust and allows you to either run queries in search of particular tweets, trending, most popular etc.
- Azure Databricks – databricks is a cloud platform that allows you to run ETL data pipelines as well as manage your data-lakehouses. You can create notebooks running on Scala, Python or other popular languages for data science/engineering. For our purpose we will have 2 notebooks – first one will generate event messages for the EventHub basis incoming tweets from the Twitter API, the second will run the ETL tasks and create output tables we will be able to load into Power BI
- Azure EventHub – the EventHub is a Microsoft Azure cloud solution for capturing and managing events for later ingestion. If you select the Standard or above tier you can setup the capturing of events into an Azure Blob Storage (into .avro files) which makes it more convenient for later processing
- Azure Blob Storage – a cheap Azure storage service for storing blobs
- Power BI – a Microsoft dashboarding solution similar to Tableau. Power BI has a Azure Databricks connector allowing you to connect directly to tables on Azure Databricks
Infrastructure Setup Guide
Twitter API
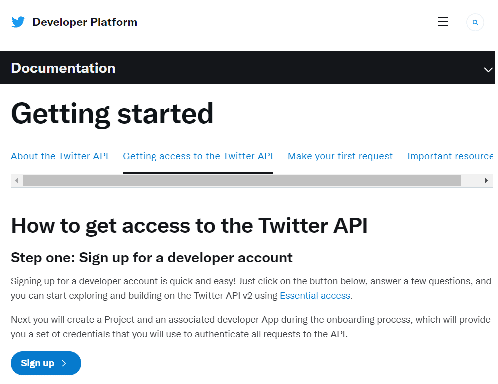
First let us start with signing up to Twitter API. Go to the Twitter Developer API page and sign-up.
Once you are logged in, you need to create a new project and within the project go to “Keys and tokens” to generate your Bearer Token. Note this token down as you will need it later.
Azure Storage Account
Our incoming Twitter data will need to be captured within our Azure Event Hub. The easiest way for us to dump the data into our data lake is to connect our Azure Event Hub to a Azure Storage Account Blob container.
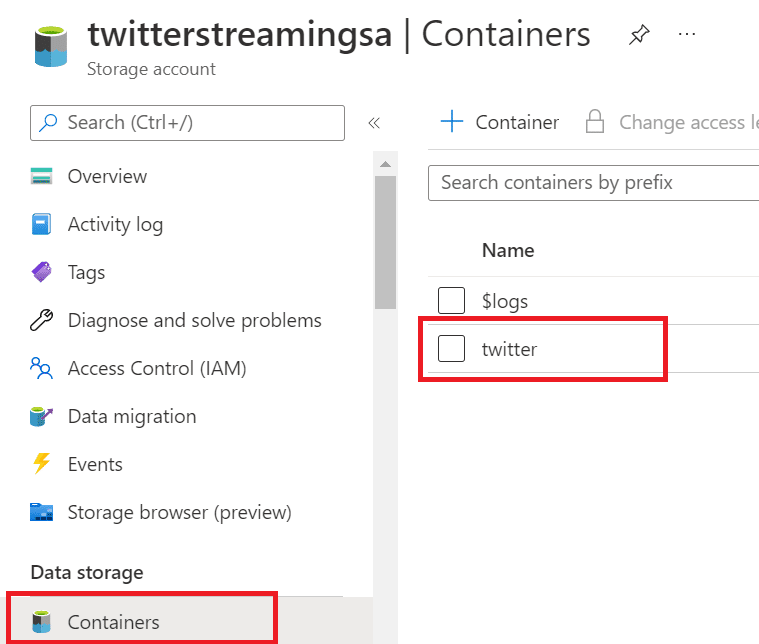
Setup an Azure Storage Account with this tutorial. Once the Account is created, open the Storage Account go to “Containers” and create a new Blob Storage container named “twitter”.
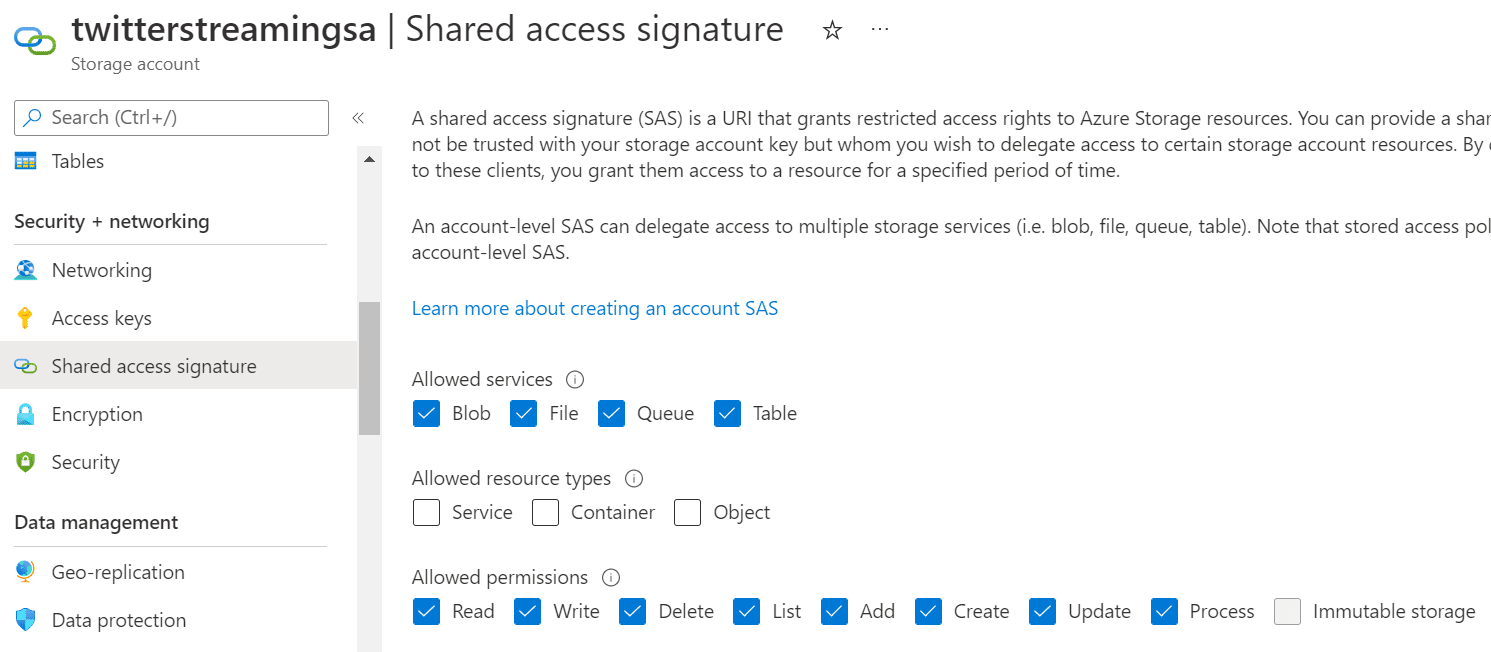
To safely access our Blob Storage we will need a SAS (Shared Access Signature), which is a temporary key needed to connect to the data on the Storage Account. Let us generate the SAS (Shared Access Signature). Again, remember to note down the SAS key!
Azure EventHub
The Azure EventHub is a great in helping capture large volume events and if needed to store them directly as AVRO files on a selected Blob Storage account.
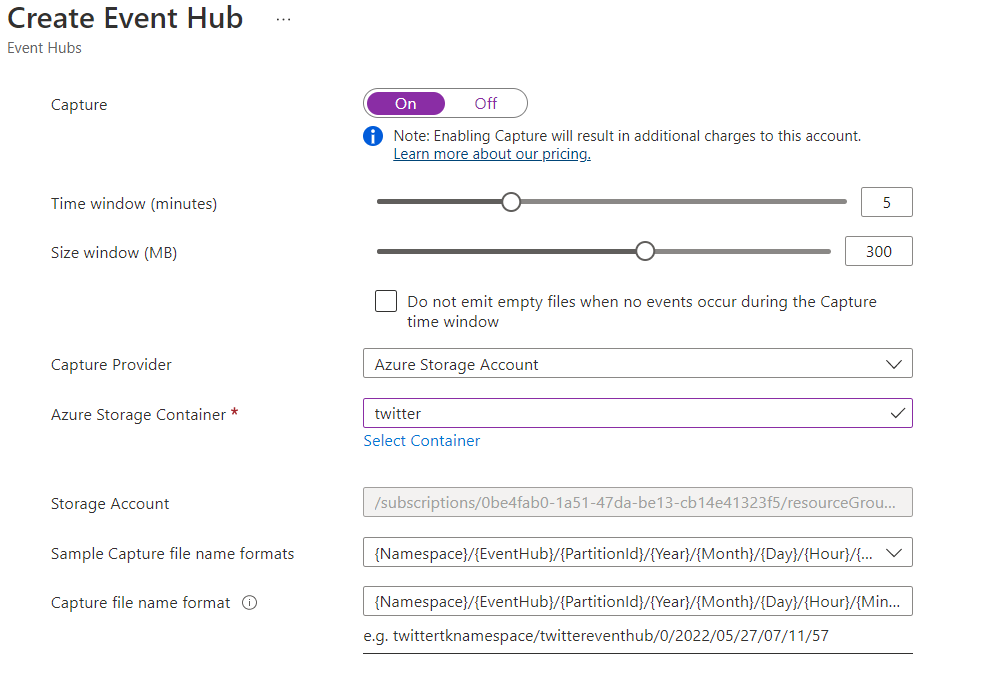
To setup an EventHub I suggest following this tutorial. First you need to create and EventHubNamespace. Once you have a Namespace open it and create an EventHub using the +Event Hub button. During configuration, remember to pick the “Standard” pricing tier in order to have access to capturing streaming events on Blob Storage. Next you should see an option called “Capture” – select On and select your Azure Storage Account and the “twitter” container you created as shown below.
Once you create your EventHub we need to create a Shared Access Policy (similar to our Storage Account SAS) to allow our Azure Databricks notebooks to send events. Open your EventHub and create a new policy as below:
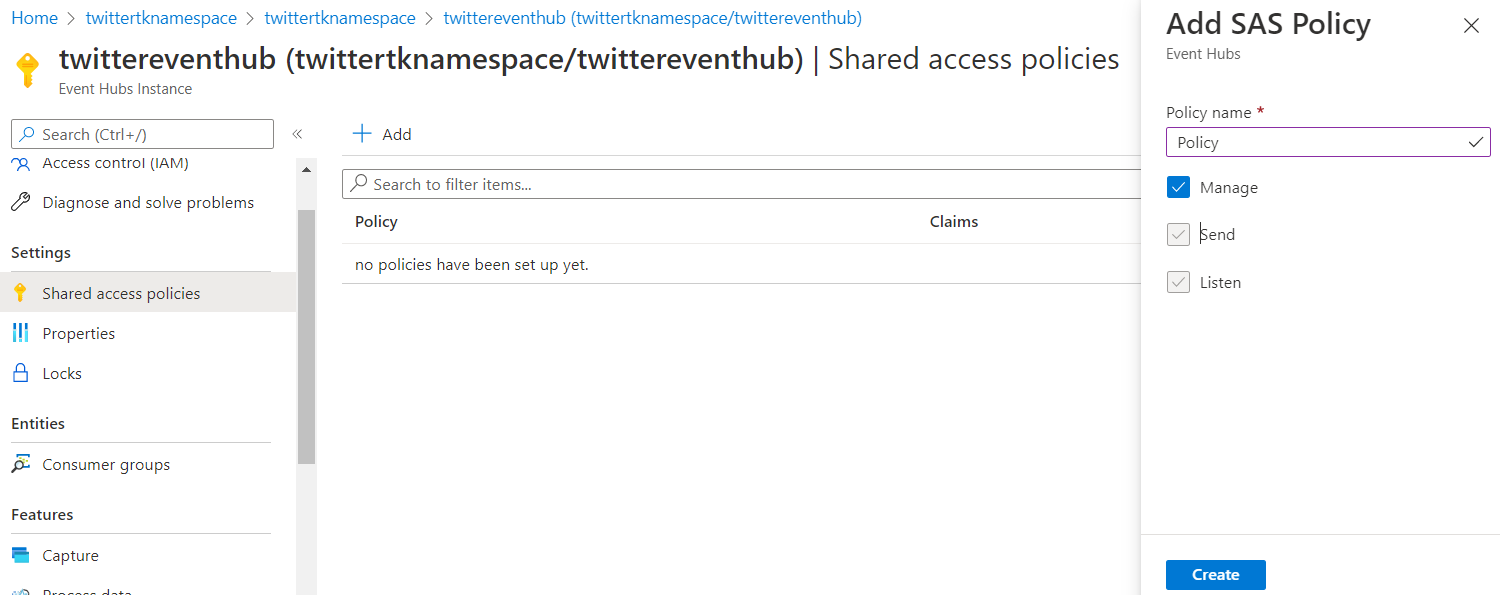
Save the name of the Shared Access Policy and its Primary Key (open the policy to get the primary key) as we will need them afterwards.
Azure Key Vault
Technically you could omit storing your keys in a Key Vault, however, it is highly recommended for security reasons. It is never a good practice to use your security keys as open text in your code – a no-brainer!
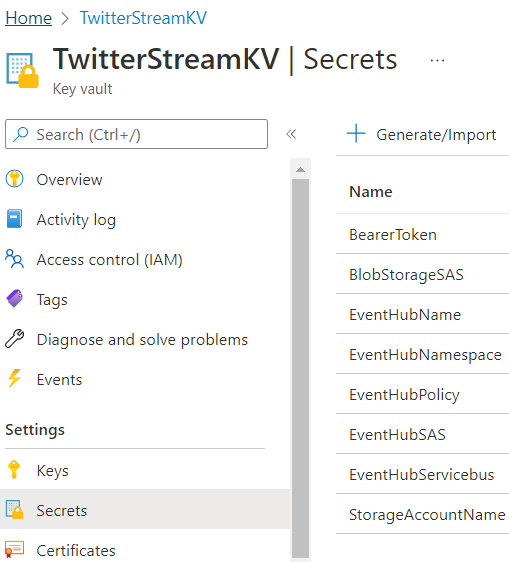
You can use this tutorial to create a Key Vault. Once created capture the following secrets in your Key Vault that hopefully you noted down above:
- BearerToken – your Twitter Bearer Token
- StorageAccountName – your Azure Storage Account name
- BlobStorageSAS – your Azure Storage Account SAS created key
- EventHubNamespace – the name of your EventHubNamespace
- EventHubName – the name of your EventHub
- EventHubPolicy – the name of the Shared Access policy you created within your EventHub with Manage permissions
- EventHubSAS – the primary key of the Shared Access Policy mentioned above
- EventHubServicebus – your EventHub Service bus
All these secrets will be used in our Azure Databricks notebooks.
Azure Databricks
The ingestion and ETL pipelines will be run using Python on Spark. Azure Databricks is a scalable datalake platform that seamless integrates with other Azure components.
Setup of Azure Databricks is pretty straightforward, if you need to feel free to follow the tutorial from MS SQL Tips.
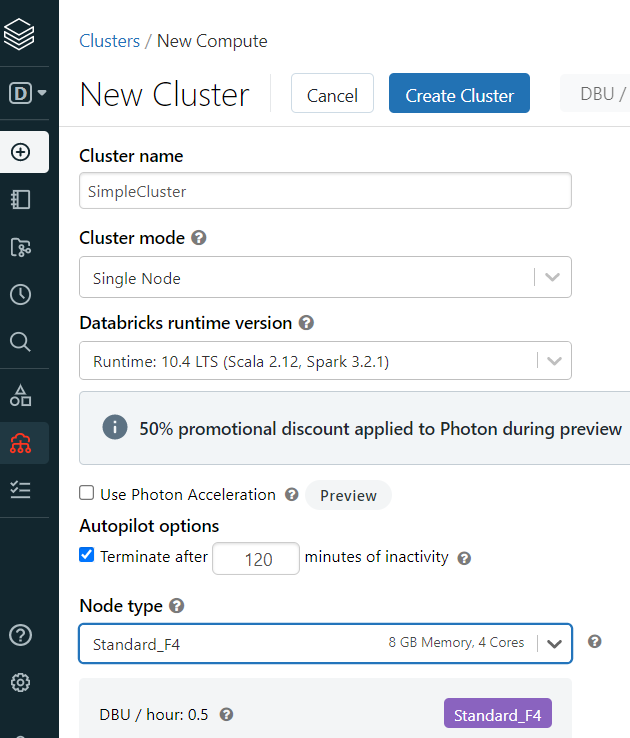
Once you create the Workspace – you need to create a Cluster. A Cluster is a single or multiple nodes of Virtual Machines that will run Spark. We will need it to run your code and notebooks. The nice thing is that you only pay for your cluster if it is running – you can also set it to auto-shutdown after some idle time.
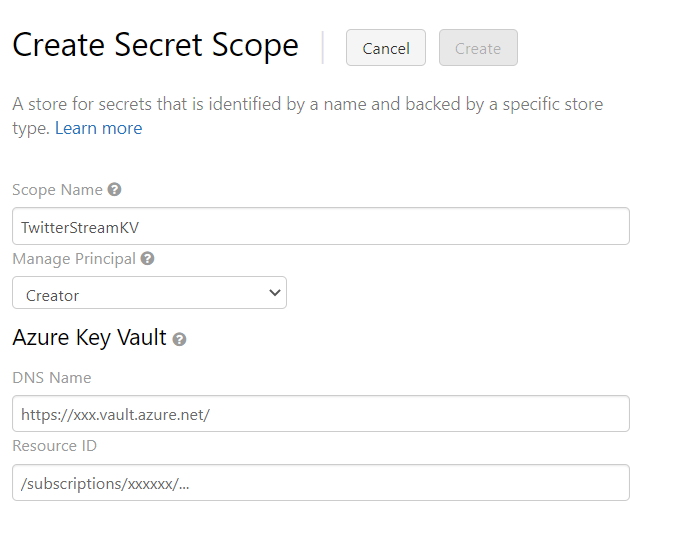
The last step you will need to perform is to create a Secret Scope. A Secret Scope allows you to directly access your Azure Key Vault secrets.
To create a Secret Scope – use the following URL:
https://
Next name your secret scope “TwitterStreamKV” and provide your Azure Key Vault DNS name and resource ID:
Finally if you have this all running – you should be good to go to do some coding to create our Twitter Power BI dashboard!
Twitter data ingestion
The Twitter API extends various ways of processing tweets. What I wanted to get on my Power BI dashboard was:
- All live streamed tweets basis a certain filter/li>
- Top trending tweets
- Top recurring tags
To tackle the problem of live streamed tweets I could leverage on the Filtered Stream. The Twitter Filtered Stream is a REST API that sends you json messages on every incoming tweets. To process these tweets we need to create a producer Python job that will capture all incoming json messages and post them to our Azure EventHub that will in turn dump these messages into avro files into our Azure Blob Storage container.
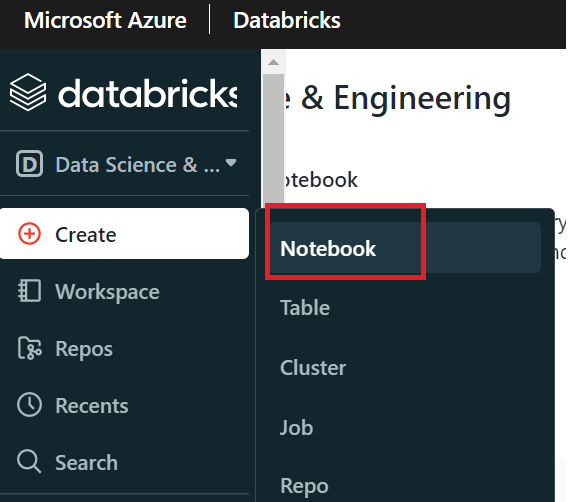
Let us start by creating a new Notebook within our Azure Workspace:
We will start by installing the eventhub library:
%pip install azure-eventhub
Next let us import all the libraries we need to capture our Tweet live stream tweets into the EventHub:
from pyspark.sql.types import *
from pyspark.sql.functions import *
from pyspark.sql import *
import datetime
import requests
import os
import json
If you named your Azure Databricks Secret Scope as “TwitterStreamKV” you can now use it to acquire the Twitter Bearer token:
bearer_token = dbutils.secrets.get(scope = "TwitterStreamKV", key = "BearerToken")
The way the API works for Filtered Stream is that you need to first set your filtering rules by submitting a REST API request. Only then can you connect to the streaming API and listen for incoming Tweets.
Set your Twitter filtering rules
Now in terms of filtering rules I decided I want to capture all tweets on the situation on the War in Ukraine. Hence as the value I am provided a set of rules that basically explain that I am looking for tweets that: mention the tags #UkraineWar or #WARINUKRAINE, are not retweets and are in English. The rule I am naming as “#UkraineWar tag”. Next I will use the request HTTP library to submit the
rules = [ {"value": "(#UkraineWar OR #WARINUKRAINE) -is:retweet lang:en", "tag": "#UkraineWar tag"}  ]
payload = {"add": rules }
response = requests.post(
        "https://api.twitter.com/2/tweets/search/stream/rules",
        auth={"Authorization":f"Bearer {bearer_token}","User-Agent" : "v2FilteredStreamPython"}
        json=payload,
    )
Stream tweets to your EventHub
Now we are ready to start streaming data! For this purpose we need to connect to our EventHub and create a EventHubProducerClient:
from azure.eventhub import EventData, EventHubProducerClient,EventHubSharedKeyCredential
eventhub_policy = dbutils.secrets.get(scope = "TwitterStreamKV", key = "EventHubPolicy")
eventhub_servicebus = dbutils.secrets.get(scope = "TwitterStreamKV", key = "EventHubServicebus")
eventhub_name = dbutils.secrets.get(scope = "TwitterStreamKV", key = "EventHubName")
eventhub_namespace = dbutils.secrets.get(scope = "TwitterStreamKV", key = "EventHubNamespace")
eventhub_sas = dbutils.secrets.get(scope="TwitterStreamKV", key = "EventHubSAS")

sk = EventHubSharedKeyCredential(eventhub_policy,eventhub_sas)
ehpc = EventHubProducerClient(fully_qualified_namespace=eventhub_servicebus, credential=sk,eventhub_name=eventhub_name)
The Producer client is now ready to start streaming messsages. We will use the requests HTTP library again to listen for Twitter API json messages on new tweets and we will immediately send them to the EventHub as new messages:
response = requests.get(
    "https://api.twitter.com/2/tweets/search/stream?expansions=author_id&tweet.fields=created_at,public_metrics", auth={"Authorization":f"Bearer {bearer_token}","User-Agent" : "v2FilteredStreamPython"}, stream=True,
)

if response.status_code != 200:
    raise Exception(
        "Cannot get stream (HTTP {}): {}".format(
            response.status_code, response.text
        )
    )
increment =  0
for response_line in response.iter_lines():
    if response_line:
        increment += 1
        print(f"Message {increment} received")
        event_data_batch = ehpc.create_batch()
        data = EventData(body=response_line)
        event_data_batch.add(data)
        ehpc.send_batch(event_data_batch)
Try running this. If all goes well you start seeing these messages:
Message 1 received
Message 2 received
Message 3 received
Message 4 received
Message 5 received
Message 6 received
Now we should be seeing avro files created in our Azure Blob Storage. If we have the live data lets start processing it.
Twitter data ETL and creation of tables
I would recommend for the following you create a new notebook. We are ready to load our Twitter data and create a simple table we could model in Power BI (Word Clouds etc.). We need to now mount our Blob Storage to access the files. Lets run the following:
try:
  storageAccountName = dbutils.secrets.get(scope = "TwitterStreamKV", key = "StorageAccountName")
  containerName = "twitter"
  dbutils.fs.mount(
    source = f"wasbs://{containerName}@{storageAccountName}.blob.core.windows.net",
    mount_point = "/mnt/twitter",
    extra_configs = {f"fs.azure.account.key.{storageAccountName}.blob.core.windows.net":dbutils.secrets.get(scope = "TwitterStreamKV", key = "BlobStorageSAS")})
  print("Mount installed")
except:
  print("Mount already installed")
We can load all our avro files into a dataframe. Now looking at the documentation I decided I am only interesting in the author_id, id, text, created_at and users of the tweet. For that we need to create a schema structure:
from pyspark.sql.types import StructType,StructField, StringType, IntegerType, DataType, ArrayType,DateType,TimestampType

tweetSchema = StructType().add("data", StructType()\
                               .add("author_id", StringType())
                               .add("id",StringType()) \
                               .add("text",StringType()) \
                               .add("created_at",TimestampType())) \
                               .add("includes",StructType() \
                                   .add("users",ArrayType(StructType() \
                                                          .add("username",StringType()) \
                                                          .add("name",StringType()) \
                                                         )) \
                                   )
This schema explains how to process a message that looks like this:
{
  "data": [
    {
      "author_id": "2244994945",
      "created_at": "2020-02-14T19:00:55.000Z",
      "id": "1228393702244134912",
      "text": "What did the developer write in their Valentine’s card?\n  \nwhile(true) {\n    I = Love(You);  \n}"
    }
  ],
  "includes": {
    "users": [
      {
        "created_at": "2013-12-14T04:35:55.000Z",
        "id": "2244994945",
        "name": "Twitter Dev",
        "username": "TwitterDev"
      }
    ]
  }
}
I can now load the messages into my dataframe. I will at the same time remove any null values to make sure the data is clean:
from pyspark.sql.functions import from_json, col, unbase64, explode,regexp_replace,lower,split, trim,length,substring
from pyspark.sql.types import StructType,StructField, StringType, IntegerType, DataType, ArrayType,DateType,TimestampType

eventhub_path = "/mnt/twitter/twitterstream/twitterhub/*/*/*/*/*/*/*.avro"

tweetSchema = StructType().add("data", StructType()\
                               .add("author_id", StringType())
                               .add("id",StringType()) \
                               .add("text",StringType()) \
                               .add("public_metrics",StructType().add("retweet_count",IntegerType()).add("like_count",IntegerType())) \
                               .add("created_at",TimestampType())) \
                               .add("includes",StructType() \
                                   .add("users",ArrayType(StructType() \
                                                          .add("username",StringType()) \
                                                          .add("name",StringType()) \
                                                         )) \
                                   )

avroDf = spark.read.format("com.databricks.spark.avro").load(eventhub_path).withColumn('json', from_json(col('Body').cast("string"),tweetSchema)).drop("SequenceNumber", "Offset","EnqueuedTimeUtc","SystemProperties","Properties")
avroDf = avroDf.filter(col("json.data").isNotNull())
}
The dataframe now includes a json and Body columns. We would like however to have our dataframe include all our tweets in individual rows making them easier to save as a table. For that we can use the withColumn dataframe method:
allTweetsDf = avroDf.withColumn("id",col("json.data.id")) \
                  .withColumn("author_id",col("json.data.author_id")) \
                  .withColumn("text",col("json.data.text")) \
                  .withColumn("author_id",col("json.data.text")) \
                  .withColumn("retweet_count",col("json.data.public_metrics.retweet_count")) \
                  .withColumn("like_count",col("json.data.public_metrics.like_count")).withColumn("created_at",col("json.data.created_at"))  \
                  .withColumn("username",col("json.includes.users").getItem(0).getField("username")).drop(col("Body")).drop(col("json"))
We are now ready to save our dataframe to a table:
allTweetsDf.write.saveAsTable("Tweets",mode="overwrite")
Done! You can re-run the notebook everytime you want to refresh your table. We are good to pull this data into Power BI and start processing it.
Setup the Twitter Power BI dashboard
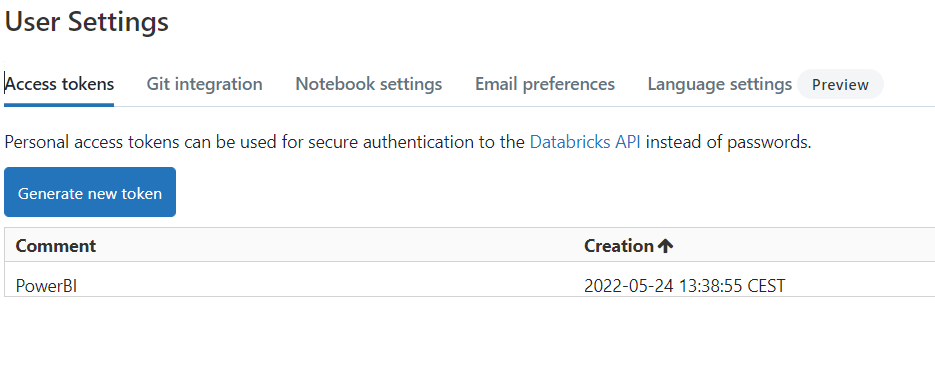
To be able to connect to your Databricks table from Power BI we need to first generate an access token as well as we will need information on the Cluster itself as the Cluster needs to be running to be able to access the table. Go to Settings and User Settings. Next go to the Generate new token button to generate a new access token. Save it as you will see it only once!
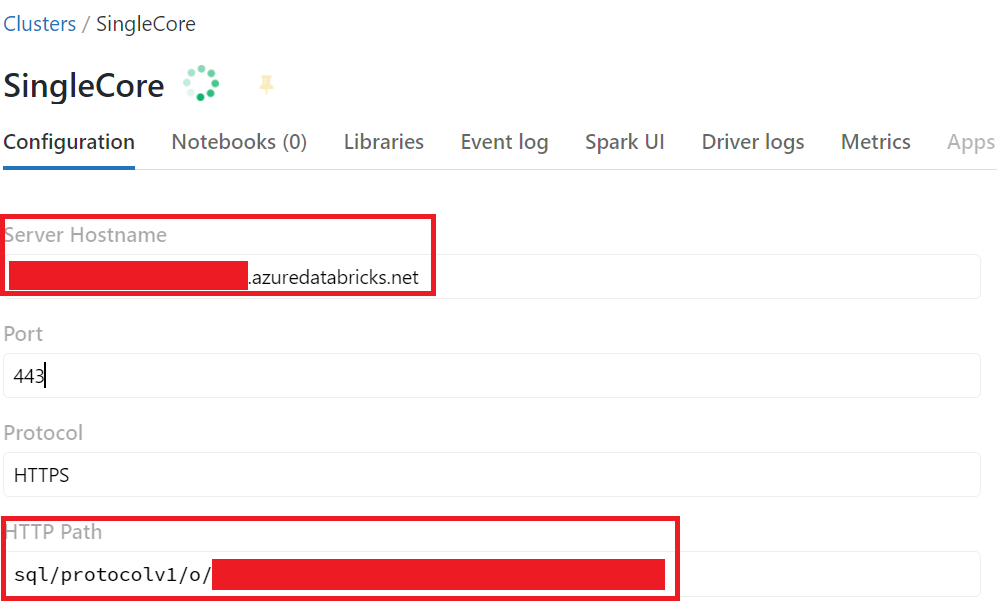
Let’s click on the Cluster and on the Configuration tab scroll down to get the Server Hostname and HTTP path. You will need both to configure Power BI.
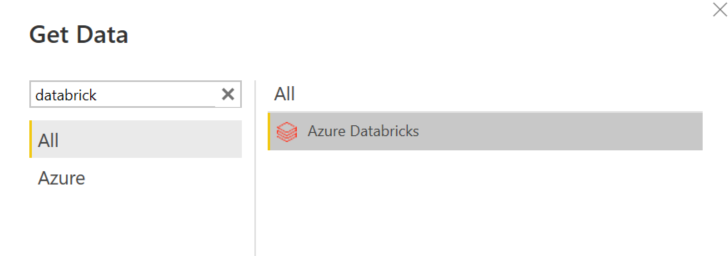
Now we can open Power BI and select our connector, if needed type “Azure Databricks” to find the needed connector:
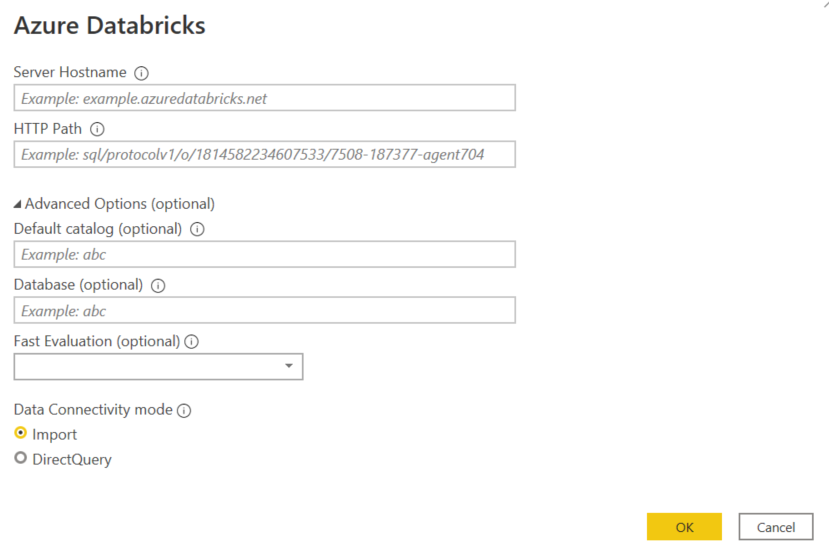
Now we should have all the information you need to configure the connector. Provide the Server Hostname and HTTP Path from the details we captured from the Databricks cluster. The Database should be Default. In terms of Data Connectivity mode we have 2 options – Import for a controlled refresh schedule and DirectQuery for a live connection.
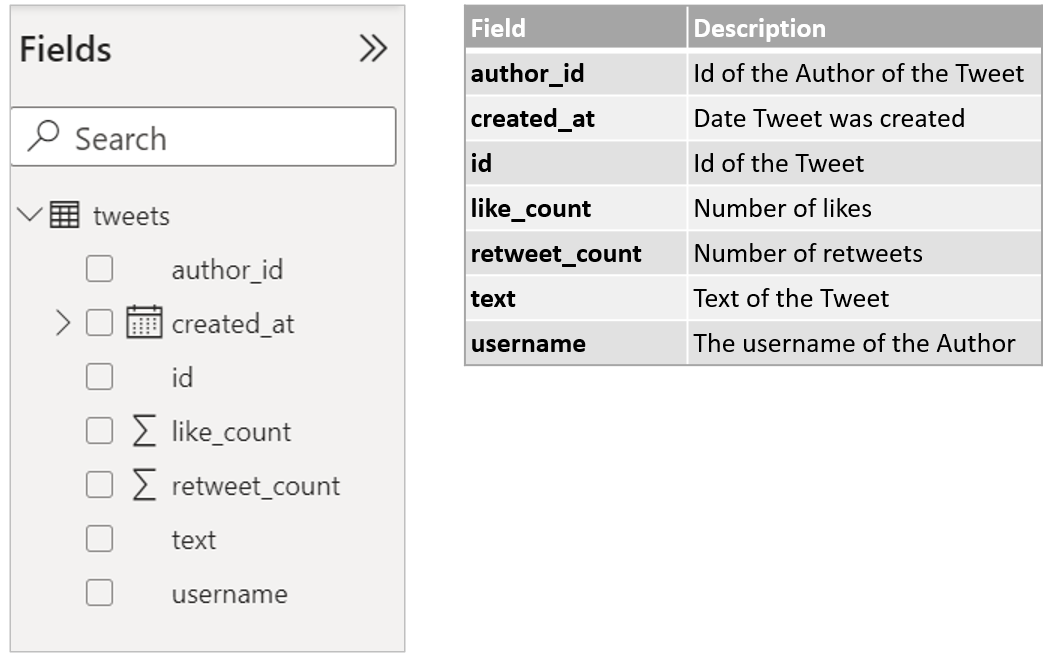
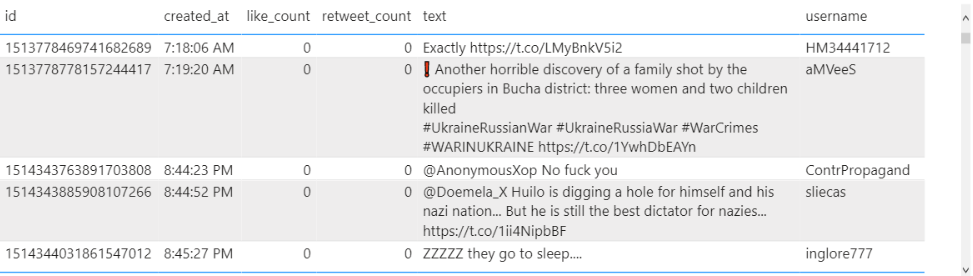
You can now load our table into Power BI. Once done we should see our Twitter table loaded. During extraction from json we selected a few key fields we wanted to use for the analysis of Twitter Queries. Below the view of our Power BI “tweets” table and an explanation of the Twitter fields.
Twitter Word Cloud and other Visuals
We can now play around with the available Twitter fields. I like to start by creating a simple Power BI Table visual including most of the fields available in our tweets table to get a good feel for the data:
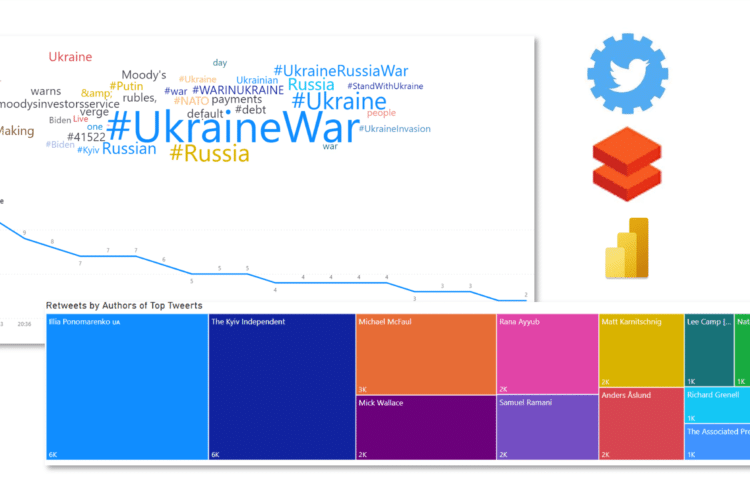
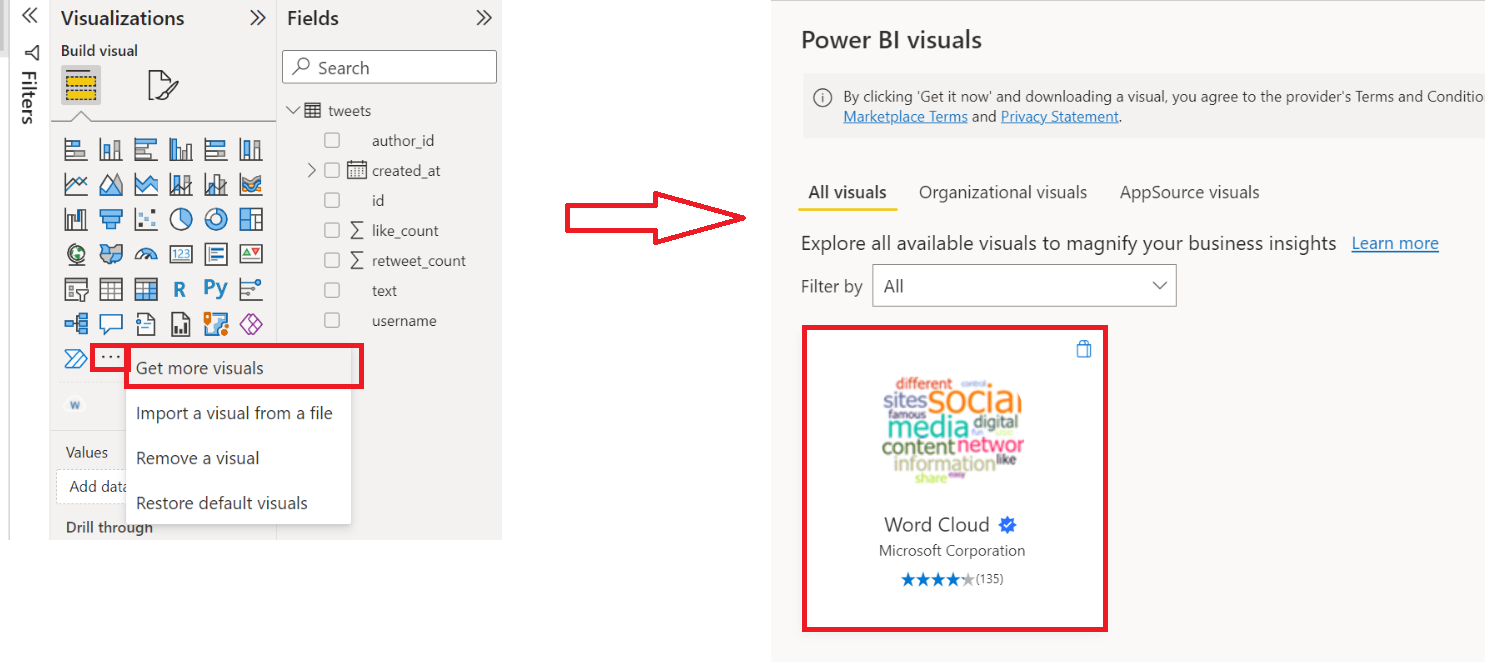
What I noticed is that a lot of Tweets include hashtags (#). It might be interesting to see what are the most frequent keywords used in our Tweets. For this I am going to use the Power BI Word Cloud. A Word Cloud is a visual that breaks down your text into individuals words and counts the number of repeats. Each word is represented on the visual as text, its size depends on the number of times the word was repeated in the data. We could do the same in PySpark (which I did – refer to the GitHub repository), however, the great thing about Power BI is that it makes it very easy to create these complex visual. As Word Clouds are not default visualizations available in Power BI click on the ... button on the Visualizations tab and select Get more visuals. Then search and select Word Cloud by Microsoft.
To create the Word Cloud simply create a new Table with just the “text” column. Next go to visuals and select the newly installed WordCloud visual. Power BI will process your tweets and create a great looking word cloud like this:
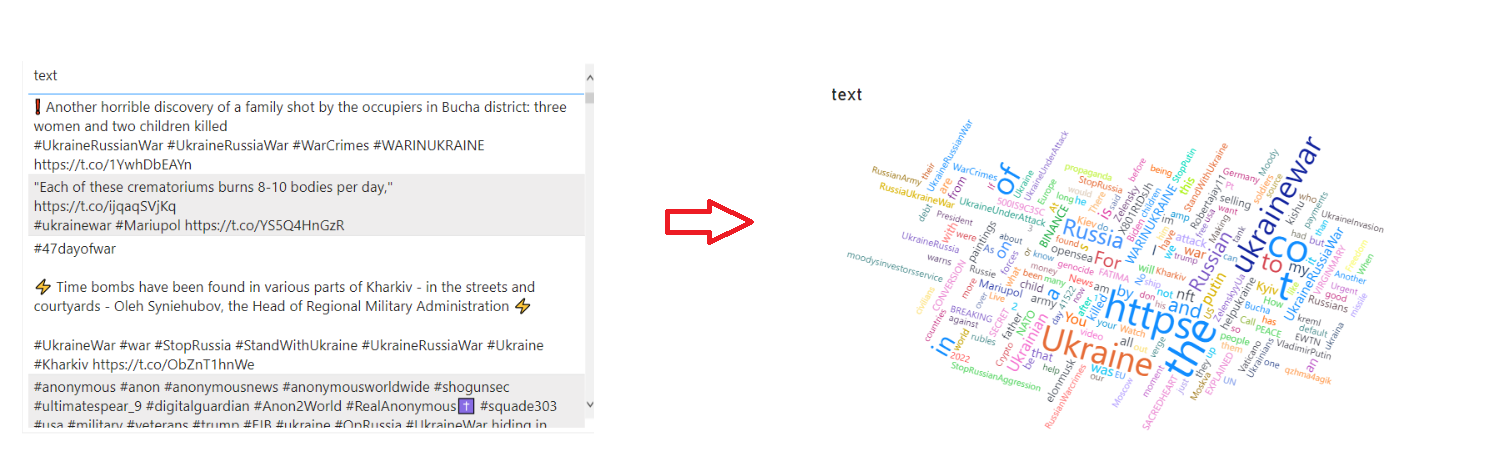
All of this took us just seconds in Power BI, no coding required.
Conclusions
The project was a great way to learn on how to create all the necessary cloud infrastructure in order to ingest data from REST API using Azure. We can now easily swap out the Twitter API with any other REST API. The benefit of setting up our infrastructure in the Cloud is that it only took us minutes to stand up an EventHub, a Storage Account as well as Databricks Cluster. We can always delete this with no further costs in case we don’t want to use it anymore.
Next we can appreciate how PySpark simplifies the usage of Python to help us extract and transform our data. Loading data from avro files is natively supported by PySpark and we could create a ready schema to load the schema of our tweets in json format. Finally we were able to save our data to Databricks Table that can be accessed from dashboard tools like Power BI for visualization.
Lastly, Power BI is an amazing tool that can save you a great deal of time once your data is clean and ready for analysis. We could have just as well created a Word Cloud in PySpark, however, that would have required a lot of manual coding as well as I would have needed to save the output to a separate table which wouldn’t have any relationship with the tweets table. In Power BI, however, if I select any keyword in my Cloud it will filter all my tweets that contain that specific keyword which is amazing!
Do let me know in the comments how you liked my Twitter Power BI project!
GitHub repository
To get the entire code base for the code used in the Twitter Power BI project, you can visit the repository on GitHub under this link:
https://github.com/tkacprow/Azure-Twitter-Tweets-Analysis


")