In this post we will explore how VBA paste from Excel to PowerPoint objects such as a Range, Chart or other element. Below you will find working code snippets. We will learn also to modify this routine to address different VBA Copy Paste from Excel to PowerPoint.
VBA Paste Range from Excel to PowerPoint
We will start with an example of VBA Paste Excel Range into PowerPoint as Picture as this is the most typical scenario. For this I created a custom function called CopyFromExcelToPPT:
1 2 3 4 5 6 7 8 9 10 11 12 13 14 15 16 17 18 19 20 21 22 23 24 25 26 27 28 29 30 31 32 33 34 35 36 37 38 39 40 | Function CopyFromExcelToPPT(excelFilePath As String, sheetName As String, rngCopy As String, dstSlide As Long, Optional shapeTop As Long, Optional shapeLeft As Long) On Error GoTo ErrorHandl 'Handle Errors 'Set Variables and Open Excel Dim eApp As Excel.Application, wb As Excel.Workbook, ppt As PowerPoint.Presentation Set eApp = New Excel.Application eApp.Visible = False Set wb = eApp.Workbooks.Open(excelFilePath) Set ppt = ActivePresentation 'Copy cells in Excel wb.Sheets(sheetName).Range(rngCopy).Copy 'Paste into first slide in active PowerPoint presentation ppt.Slides(dstSlide).Shapes.PasteSpecial ppPasteBitmap 'Close and clean-up Excel wb.Close SaveChanges:=False eApp.Quit Set wb = Nothing: Set eApp = Nothing 'Move the new shape if left/top provided If Not (IsMissing(shapeTop)) Then With ppt.Slides(dstSlide).Shapes(ppt.Slides(dstSlide).Shapes.Count) .Left = shapeLeft .Top = shapeTop End With End If CopyFromExcelToPPT = True Exit FunctionErrorHandl: 'Make sure to close the workbook and Excel and return False On Error Resume Next If Not (eApp Is Nothing) Then wb.Close SaveChanges:=False eApp.Quit End If CopyFromExcelToPPT = FalseEnd Function |
What does the VBA Function do? In short you need to provide the following parameters:
- excelFilePath – full file path to the Excel from which you want to copy a VBA Range
- sheetName – the Sheet name from which you want to copy
- rngCopy – the VBA Range you want to copy
- dstSlide – the number of the slide (starting at 1) to which you want to copy the Range
- shapeTop – Optional. The Top position in pixels of the new pasted Shape
- shapeLeft – Optional. The Left position in pixels of the new pasted Shape
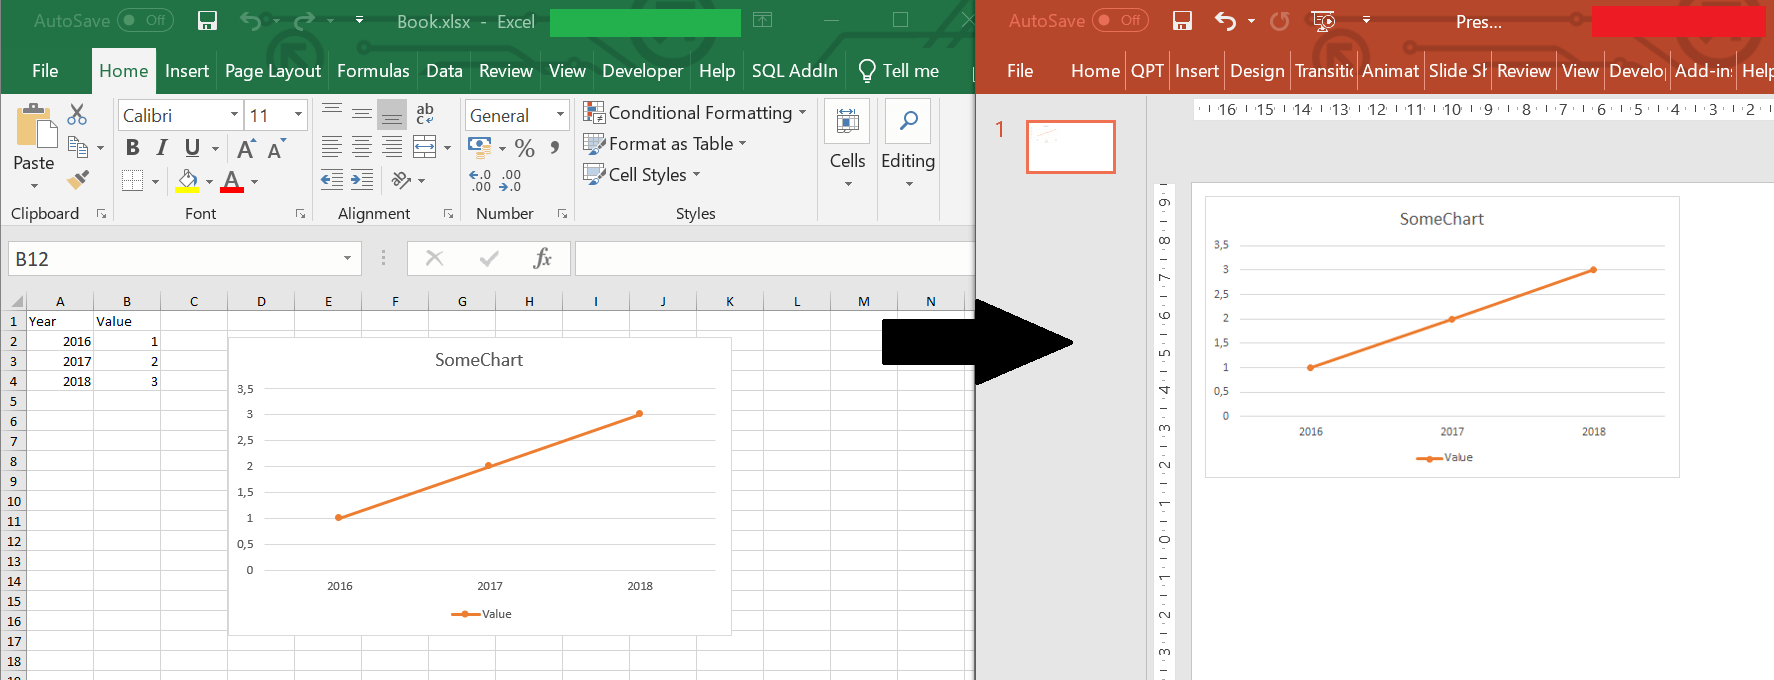
Let us use this function in the following scenario. We want to copy range A1:B4.

Let us use our function above for this scenario
1 2 3 4 5 6 7 8 | Sub Test()'Copy from Excel worksheet named Sheet1 the A1:B4 rangeIf CopyFromExcelToPPT("C:\Book.xlsx", "Sheet1", "A1:B4", 1) Then Debug.Print "Success" Else Debug.Print "Failure" End If End Sub |
VBA Paste Chart from Excel to PowerPoint
Now an example of VBA Paste Excel Graph into PowerPoint as Picture as this is also a useful case. For this I created a custom function called CopyChartFromExcelToPPT:
1 2 3 4 5 6 7 8 9 10 11 12 13 14 15 16 17 18 19 20 21 22 23 24 25 26 27 28 29 30 31 32 33 34 35 36 37 38 39 40 | Function CopyChartFromExcelToPPT(excelFilePath As String, sheetName As String, chartName As String, dstSlide As Long, Optional shapeTop As Long, Optional shapeLeft As Long) On Error GoTo ErrorHandl 'Handle Errors 'Set Variables and Open Excel Dim eApp As Excel.Application, wb As Excel.Workbook, ppt As PowerPoint.Presentation, ws As Excel.Worksheet Set eApp = New Excel.Application eApp.Visible = False Set wb = eApp.Workbooks.Open(excelFilePath) Set ppt = ActivePresentation 'Copy Chart in Excel wb.Sheets(sheetName).ChartObjects(chartName).Copy 'Paste into first slide in active PowerPoint presentation ppt.Slides(dstSlide).Shapes.PasteSpecial ppPasteBitmap 'Close and clean-up Excel wb.Close SaveChanges:=False eApp.Quit Set wb = Nothing: Set eApp = Nothing 'Move the new shape if left/top provided If Not (IsMissing(shapeTop)) Then With ppt.Slides(dstSlide).Shapes(ppt.Slides(dstSlide).Shapes.Count) .Left = shapeLeft .Top = shapeTop End With End If CopyChartFromExcelToPPT = True Exit FunctionErrorHandl: 'Make sure to close the workbook and Excel and return False On Error Resume Next If Not (eApp Is Nothing) Then wb.Close SaveChanges:=False eApp.Quit End If CopyChartFromExcelToPPT = FalseEnd Function |
Again let us use it on the example below where we want to copy a Chart from a Excel Workbook to PowerPoint:

Example execution of the VBA Function below:
1 2 3 4 5 6 7 | Sub Test() If CopyChartFromExcelToPPT("C:\Book.xlsx", "Sheet1", "Chart 1", 1) Then Debug.Print "Success" Else Debug.Print "Failure" End IfEnd Sub |
If you want to place the Chart at a specific place use the shapeTop and shapeLeft arguments. The below will place the chart at 10 pixels from the Top and 100 pixels from the Left.
1 2 3 4 5 6 7 | Sub Test() If CopyChartFromExcelToPPT("C:\Book.xlsx", "Sheet1", "Chart 1", 1, 10, 100) Then Debug.Print "Success" Else Debug.Print "Failure" End IfEnd Sub |
Changing Height / Width of pasted elements
In the examples above we didn’t change the Width and Height of the pasted Range or Chart. To do this use the adjusted functions below:
1 2 3 4 5 6 7 8 9 10 11 12 13 14 15 16 17 18 19 20 21 22 23 24 25 26 27 28 29 30 31 32 33 34 35 36 37 38 39 40 41 42 43 44 45 46 47 48 49 50 51 52 53 54 55 56 57 58 59 60 61 62 63 64 65 66 67 68 69 70 71 72 73 74 75 76 77 78 79 80 81 82 83 84 85 86 87 88 89 90 91 92 93 94 95 96 | Function CopyFromExcelToPPT(excelFilePath As String, sheetName As String, rngCopy As String, dstSlide As Long, Optional shapeTop As Long, Optional shapeLeft As Long, Optional shapeHeight As Long, Optional shapeWidth As Long) On Error GoTo ErrorHandl 'Handle Errors 'Set Variables and Open Excel Dim eApp As Excel.Application, wb As Excel.Workbook, ppt As PowerPoint.Presentation Set eApp = New Excel.Application eApp.Visible = False Set wb = eApp.Workbooks.Open(excelFilePath) Set ppt = ActivePresentation 'Copy cells in Excel wb.Sheets(sheetName).Range(rngCopy).Copy 'Paste into first slide in active PowerPoint presentation ppt.Slides(1).Shapes.PasteSpecial ppPasteBitmap 'Close and clean-up Excel wb.Close SaveChanges:=False eApp.Quit Set wb = Nothing: Set eApp = Nothing 'Move the new shape if left/top provided If Not (IsMissing(shapeTop)) Then With ppt.Slides(1).Shapes(ppt.Slides(1).Shapes.Count) .Left = shapeLeft .Top = shapeTop End With End If 'Resize the shape if height/width provided If Not (IsMissing(shapeHeight)) Then With ppt.Slides(dstSlide).Shapes(ppt.Slides(1).Shapes.Count) .Height = shapeHeight .Width = shapeWidth End With End If CopyFromExcelToPPT = True Exit FunctionErrorHandl: 'Make sure to close the workbook and Excel and return False On Error Resume Next If Not (eApp Is Nothing) Then wb.Close SaveChanges:=False eApp.Quit End If CopyFromExcelToPPT = FalseEnd FunctionFunction CopyChartFromExcelToPPT(excelFilePath As String, sheetName As String, chartName As String, dstSlide As Long, Optional shapeTop As Long, Optional shapeLeft As Long, Optional shapeHeight As Long, Optional shapeWidth As Long) On Error GoTo ErrorHandl 'Handle Errors 'Set Variables and Open Excel Dim eApp As Excel.Application, wb As Excel.Workbook, ppt As PowerPoint.Presentation, ws As Excel.Worksheet Set eApp = New Excel.Application eApp.Visible = False Set wb = eApp.Workbooks.Open(excelFilePath) Set ppt = ActivePresentation 'Copy Chart in Excel wb.Sheets(sheetName).ChartObjects(chartName).Copy 'Paste into first slide in active PowerPoint presentation ppt.Slides(dstSlide).Shapes.PasteSpecial ppPasteBitmap 'Close and clean-up Excel wb.Close SaveChanges:=False eApp.Quit Set wb = Nothing: Set eApp = Nothing 'Move the new shape if left/top provided If Not (IsMissing(shapeTop)) Then With ppt.Slides(dstSlide).Shapes(ppt.Slides(1).Shapes.Count) .Height = shapeHeight .Width = shapeWidth End With End If 'Resize the shape if height/width provided If Not (IsMissing(shapeHeight)) Then With ppt.Slides(dstSlide).Shapes(ppt.Slides(1).Shapes.Count) .Height = shapeHeight .Width = shapeWidth End With End If CopyChartFromExcelToPPT = True Exit FunctionErrorHandl: 'Make sure to close the workbook and Excel and return False On Error Resume Next If Not (eApp Is Nothing) Then wb.Close SaveChanges:=False eApp.Quit End If CopyChartFromExcelToPPT = FalseEnd Function |


Good example Tom. I found life more complicated because Powerpoint takes a long time to render the table for later use, so I use Sleep to give PP 2000 ms to catch up. The code is too long to paste here, but that’s the principle. On the Mac it was so slow I gave up copy/paste and used Excel VBA to export charts to files and write a VBA sub to import into Mac PP to do the work.
PasteSpecial is for charts, for tables I use
mPPAppObject.CommandBars.ExecuteMso “PasteExcelTableSourceFormatting”
Sub pptexcl()
Dim ppt As New PowerPoint.Application
Dim pre As PowerPoint.Presentation
Dim wb As Workbook
Set wb = ThisWorkbook
Set pre = ppt.Presentations.Open(“C:\Users\Joynewton.K\Desktop\new requirement.pptm”)
Dim xslide As Integer
Dim xshape As Integer
Dim xrow As Integer
Dim xcolumn As Integer
Dim yslide As Integer
Dim yshape As Integer
Dim yrow As Integer
Dim ycolumn As Integer
wb.Activate
With ThisWorkbook.Sheets(“Sheet1”)
xslide = Range(“A3”).Value
xshape = Range(“B3”).Value
xrow = Range(“C3”).Value
xcolumn = Range(“D3”).Value
yslide = Range(“E3”).Value
yshape = Range(“F3”).Value
yrow = Range(“G3”).Value
ycolumn = Range(“H3”).Value
End With
pre.Application.Activate
pre.Slides(xslide).Shapes(xshape).Table.Columns(1).Select
ActiveWindow.Selection.Copy
pre.Slides(yslide).Shapes.Paste
End Sub
above is my coding..
INPUT OUTPUT
Slide# Shape# Row# Column# Slide# Shape# Row# Column#
1 2 3 3 2 2 2 1
declared variables will get values from above small table assumption.
my code runs but it copies and paste the value as only 2 though i changed the rows and columns.
while every time running my macros simply runs without errors copy and paste as 2.
can anyone can help me in this issue.
i will be very gratefull.
thanks