Straying from usual VBA topics let us explore today another tool that can be easily created in Excel. Who said you need MS Project to play with Gantt Charts? Today we will explore the Gantt Chart and answer questions like “How to create a gantt chart in excel?”. You will find a useful Excel Gantt Chart Template that automatically regenerates using VBA.

What is a Gantt Chart?
So what is a Gantt Chart?
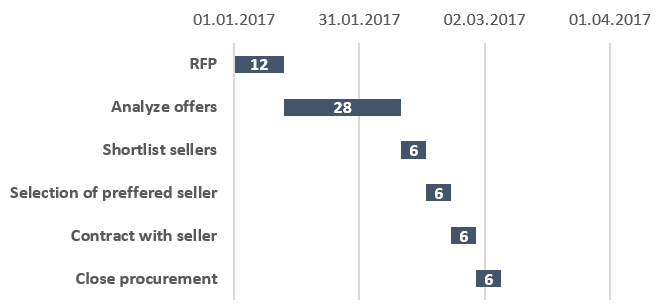
A Gantt Chart is a chart that visualizes the amount of work done or planned with a series of horizontal lines (or rectangles). Gantt Charts are useful in managing projects, planning production and resource management. The Gantt Chart is easily one of the basic tools used in Project Management.

Above you can see a very simple Gantt chart. In its most simple form a Gantt Chart consists of a list of Tasks with Start and End Dates.
From experience I can tell that you rarely need more than this to manage the everyday progress of your projects schedule.
Excel Gantt Chart Tutorial
Now that you know what a Gantt Chart is let us explore a simple way to create a Gantt Chart in Excel:
Create an Excel Table
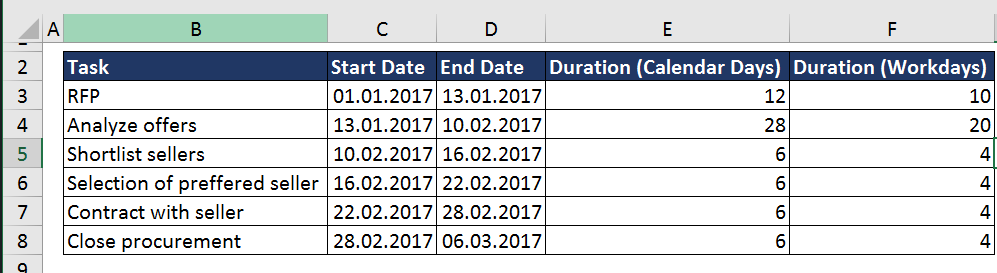 Create an Excel Table with the following columns:
- Task– list of tasks to be performed
- Start Date – the start date of the task
- End Date – the end date of the task (last date when task is to be performed)
- Duration (Calendar Days) – the amount of calendar days between the start and end dates
- Duration (Work Days) – the amount of work days between the start and end date
The Excel Table contains 2 formulas:
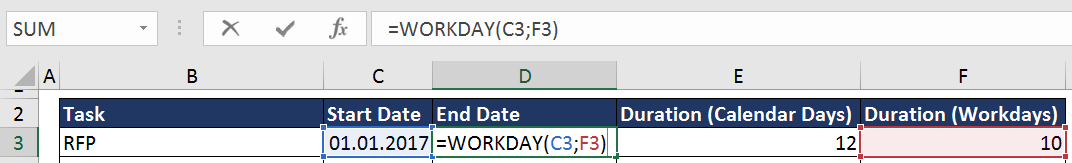
The formula above calculates the End Date of the task based on the duration provided in Work Days.
This formula uses the WORKDAYS function which returns a date (End Date) by adding a specified number of Work Days to a certain date (Start Date).
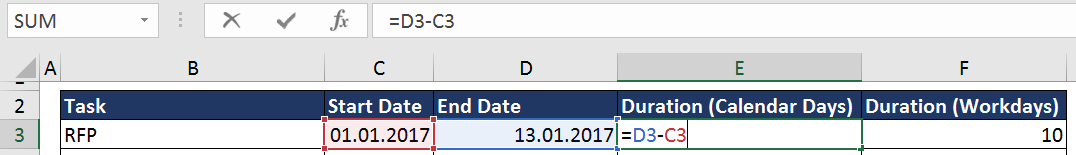
The formula above calculates the amount of Calendar Days between the Start Date of the Task and the End Date automatically calculated earlier based on the amount of Work Days.
Want to set dates manually and have the Duration (in Work Days) calculated instead? Move to my Gantt Tips & Tricks section below.
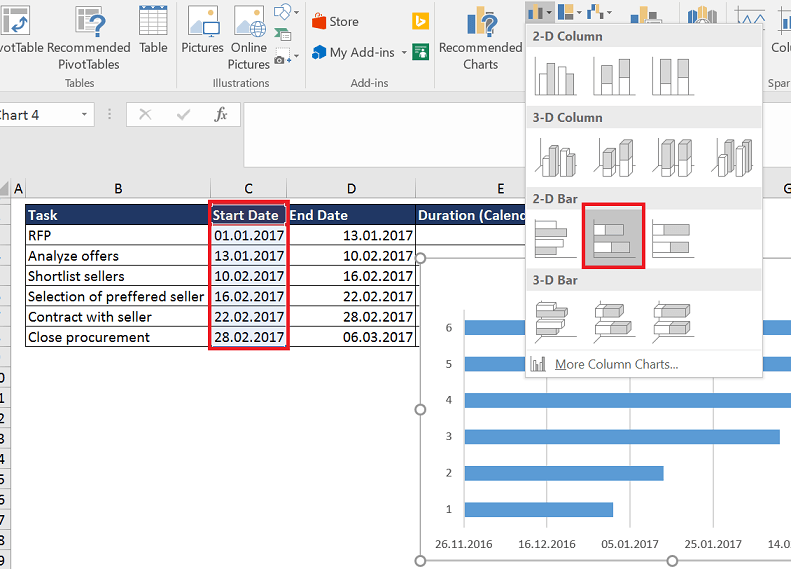
Create a 2-D Stacked Bar Excel Chart
Now that we have our source table we can use it to create an Excel Gantt Chart. Select the Start Date column and create a 2-D Stacked Bar Excel chart.
Add Duration series and Task labels to Gantt Chart
Now we need to add the Duration data series to the Chart as well as add Tasks as labels on our vertical axis.
- Right-click on the chart and select Select Data.
- Click the Add and add the Duration column data series and click Ok
- Now click the Edit button on the right and in Axis label range select the tasks in the Tasks column of your table and click Ok
- Click Ok on the Select Data Source form to close
Hide Start Date bar on Gantt Chart
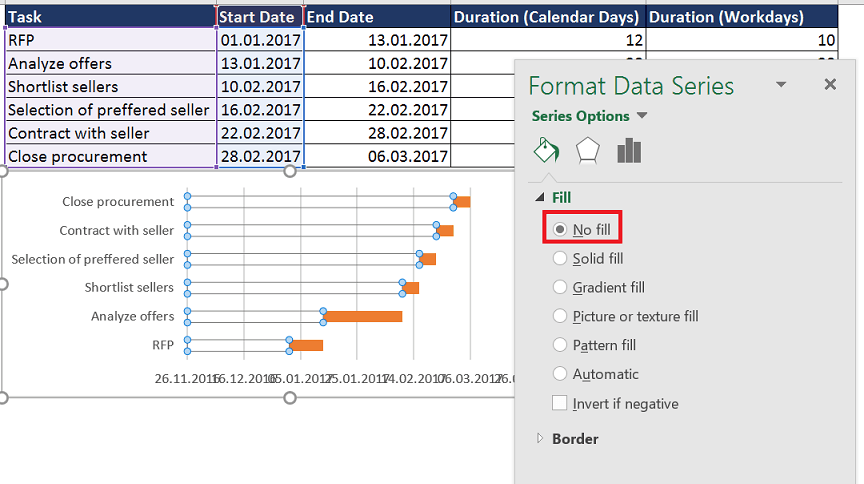
The charts above don’t resemble an actual Gantt Chart yet. What is still bothering is the blue bar on the left. To hide this bar right-click and select Format Data Series. Next go to the Fill section and select the No Fill radio button as shown below:
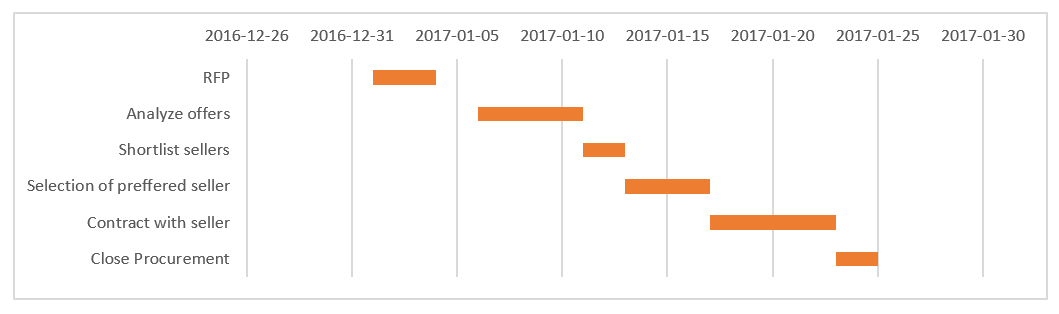
Our Gantt Chart should now look like the one below:

Again one thing bothers us – the Tasks are in the incorrect order!
Reverse Tasks vertical axis order
The last thing left for us to do is reverse the order of the Tasks on our vertical axis. To do this right-click on the Tasks vertical axis and select Format Axis next in Axis Options select the Categories in reverse order radio button.
That is it! You have now a wonderful and simple Gantt Chart that will refresh automatically based on your Excel Table.
Gantt Chart Template
Don’t have time to create your own Gantt Chart from scratch? Get it now and support new great posts from AnalystCave.com!
https://analystcave.com/product/excel-gantt-chart-template


")