I always wanted to utilize the beautiful and interactive Google Charts in Excel. The Google Charts repository is constantly growing and sometimes Excel lacks those features. Hence I introduce the Excel Google Charts Tool to display a way to leverage some of those Google Charts directly in Excel.
The Excel Google Charts Tool contains example Google Charts embedded inside an Excel xlsm file allowing you to visualize data in a more attractive way and enabling more user interaction.
Excel Google Charts: Gauge Chart
Gauge charts are extremely useful to highlight important values in reports. You can also visualize the good and bad ranges of values e.g. orange and red for too high values. These however, can be easily configured. I
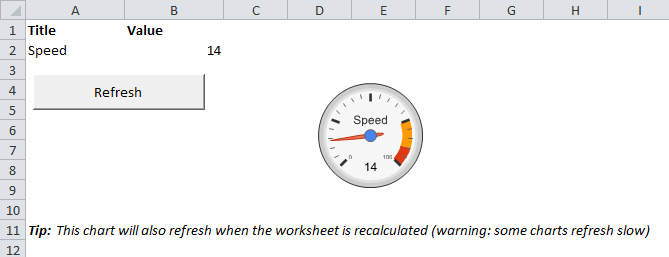
How to configure a Gauge Chart?
Excel Google Charts: Treemap Chart
Treemaps can be particularly useful when you want to drill-down data values e.g. used disk space and drill-down across folders. Google Treemaps have 2 values which you can visualize – the area of the treemap and the color.
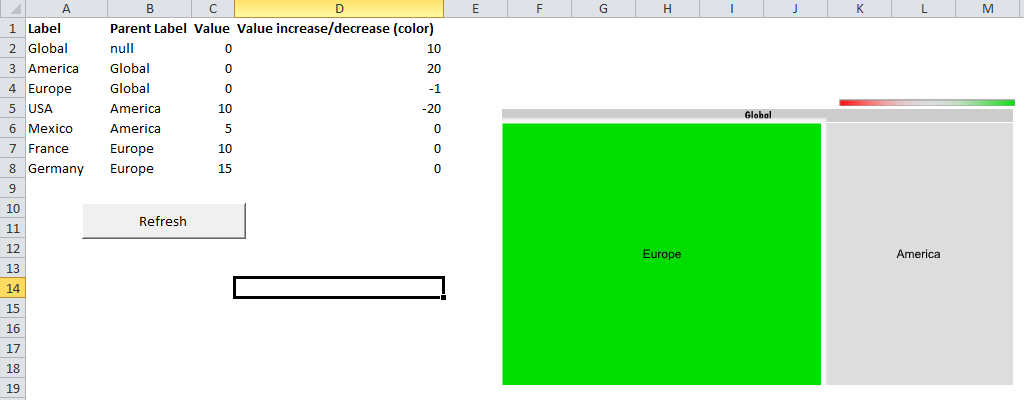
How to configure a Treemap Chart?
Excel Google Charts: Org Chart
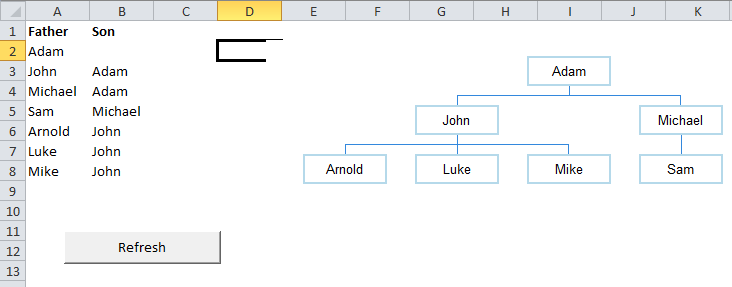
How to configure a Org Chart?
Org Charts come in handy when you want to visualize the tree/organisational structure.
Google Charts: Org Chart
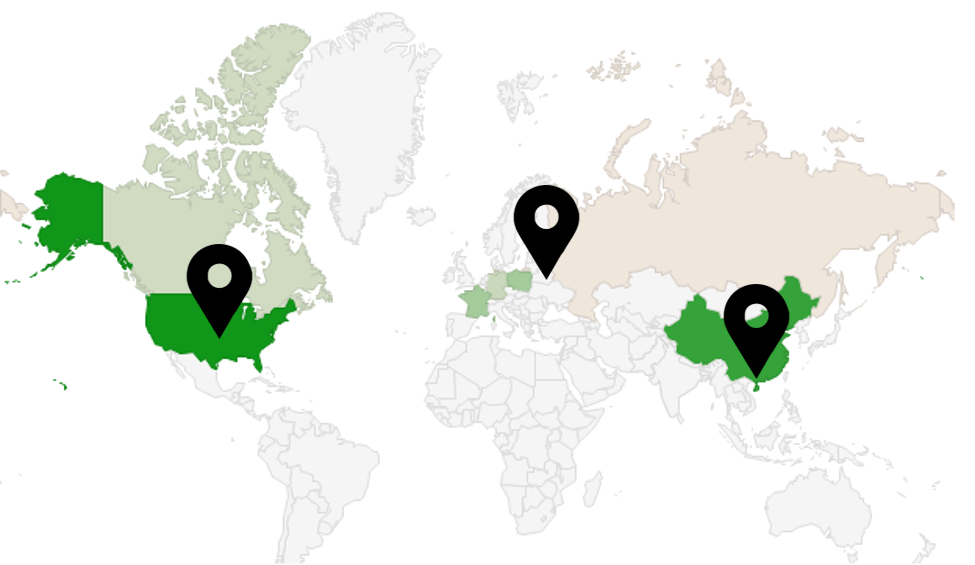
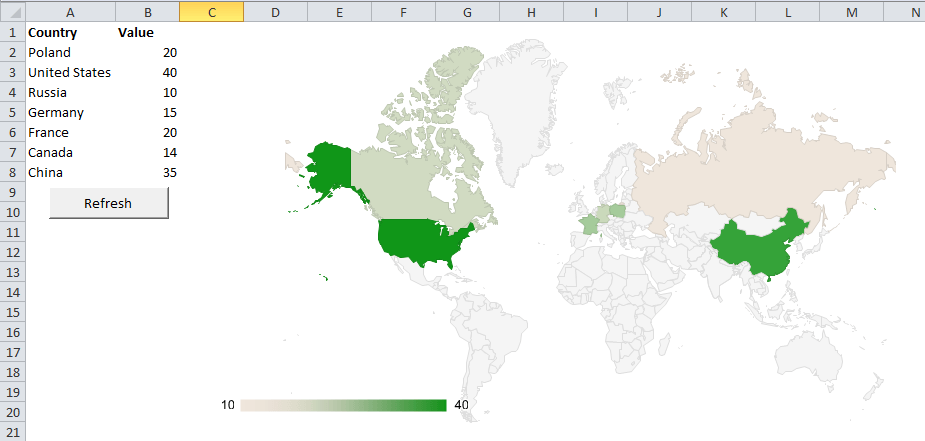
Excel Google Charts: Geo Chart
I would say – one of the most useful charts when playing with geo-data. Using the Geo Chart you can easily visualize how your data is broken down across countries. You can zoom in the Geo Chart just to show a single continent, country or region.
How to configure a Geo Chart?
Download
The file below contains all examples of Google Charts used in the Excel Google Charts Tool.
Download
Currently the Google Chart Tool contains examples of the following Google Charts:
Issues and errors
One issue you might stumble on when using the above Google Charts may be due to recent scriptable control restrictions imposed by Microsoft. Due to these in Excel 2013 and above Excel will restrict (by default) the use of some controls e.g. Microsoft Web Browser Control – which is required to run the above Google Charts. There is a way around that so utilize the link above to read more.


")